
Page 31 - 2018 National Home Improvement
P. 31
2018 National Home Improvement Estimator, All Rights Reserved Page 21
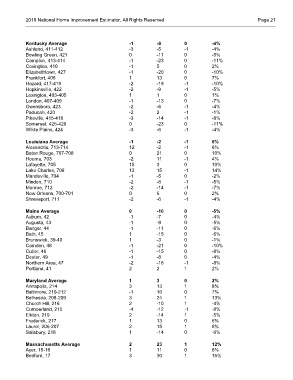
Kentucky Average -1 -8 0 -4%
Ashland, 411-412 -3 -5 -1 -4%
Bowling Green, 421 0 -11 0 -5%
Campton, 413-414 -1 -23 0 -11%
Covington, 410 -1 5 0 2%
Elizabethtown, 427 -1 -20 0 -10%
Frankfort, 406 1 13 0 7%
Hazard, 417-418 -2 -19 -1 -10%
Hopkinsville, 422 -2 -9 -1 -5%
Lexington, 403-405 1 1 0 1%
London, 407-409 -1 -13 0 -7%
Owensboro, 423 -2 -6 -1 -4%
Paducah, 420 -2 2 -1 -1%
Pikeville, 415-416 -3 -14 -1 -8%
Somerset, 425-426 0 -23 0 -11%
White Plains, 424 -3 -6 -1 -4%
Louisiana Average -1 -2 -1 0%
Alexandria, 713-714 12 -2 -1 6%
Baton Rouge, 707-708 0 21 0 10%
Houma, 703 -2 11 -1 4%
Lafayette, 705 15 3 0 10%
Lake Charles, 706 13 15 -1 14%
Mandeville, 704 -1 -5 0 -2%
Minden, 710 -2 -8 -1 -5%
Monroe, 712 -2 -14 -1 -7%
New Orleans, 700-701 0 5 0 2%
Shreveport, 711 -2 -6 -1 -4%
Maine Average 0 -10 0 -5%
Auburn, 42 -1 -7 0 -4%
Augusta, 43 -1 -9 0 -5%
Bangor, 44 -1 -11 0 -6%
Bath, 45 1 -15 0 -6%
Brunswick, 39-40 1 -3 0 -1%
Camden, 48 -1 -21 0 -10%
Cutler, 46 -1 -15 0 -8%
Dexter, 49 -1 -8 0 -4%
Northern Area, 47 -2 -16 -1 -8%
Portland, 41 2 2 1 2%
Maryland Average 1 3 0 2%
Annapolis, 214 3 13 1 8%
Baltimore, 210-212 -1 16 0 7%
Bethesda, 208-209 3 24 1 13%
Church Hill, 216 2 -10 1 -4%
Cumberland, 215 -4 -12 -1 -8%
Elkton, 219 2 -14 1 -5%
Frederick, 217 1 13 0 6%
Laurel, 206-207 2 15 1 8%
Salisbury, 218 1 -14 0 -6%
Massachusetts Average 2 23 1 12%
Ayer, 15-16 1 11 0 6%
Bedford, 17 3 30 1 15%