
Page 30 - 2018 National Home Improvement
P. 30
2018 National Home Improvement Estimator, All Rights Reserved Page 20 (part 2)
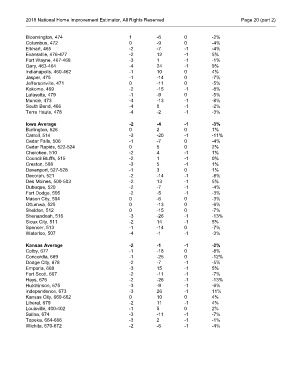
Bloomington, 474 1 -6 0 -2%
Columbus, 472 0 -9 0 -4%
Elkhart, 465 -2 -7 -1 -4%
Evansville, 476-477 -2 12 -1 5%
Fort Wayne, 467-468 -3 1 -1 -1%
Gary, 463-464 -4 24 -1 9%
Indianapolis, 460-462 -1 10 0 4%
Jasper, 475 -1 -14 0 -7%
Jeffersonville, 471 0 -11 0 -5%
Kokomo, 469 -2 -15 -1 -8%
Lafayette, 479 -1 -9 0 -5%
Muncie, 473 -4 -13 -1 -8%
South Bend, 466 -4 0 -1 -2%
Terre Haute, 478 -4 -2 -1 -3%
Iowa Average -2 -4 -1 -3%
Burlington, 526 0 2 0 1%
Carroll, 514 -3 -20 -1 -11%
Cedar Falls, 506 -1 -7 0 -4%
Cedar Rapids, 522-524 0 5 0 2%
Cherokee, 510 -2 4 -1 1%
Council Bluffs, 515 -2 1 -1 0%
Creston, 508 -3 5 -1 1%
Davenport, 527-528 -1 3 0 1%
Decorah, 521 -2 -14 -1 -8%
Des Moines, 500-503 -2 13 -1 5%
Dubuque, 520 -2 -7 -1 -4%
Fort Dodge, 505 -2 -5 -1 -3%
Mason City, 504 0 -6 0 -3%
Ottumwa, 525 0 -13 0 -6%
Sheldon, 512 0 -15 0 -7%
Shenandoah, 516 -3 -26 -1 -13%
Sioux City, 511 -2 14 -1 5%
Spencer, 513 -1 -14 0 -7%
Waterloo, 507 -4 -1 -1 -3%
Kansas Average -2 -1 -1 -2%
Colby, 677 -1 -18 0 -8%
Concordia, 669 -1 -25 0 -12%
Dodge City, 678 -2 -7 -1 -5%
Emporia, 668 -3 15 -1 5%
Fort Scott, 667 -2 -11 -1 -7%
Hays, 676 -2 -26 -1 -13%
Hutchinson, 675 -3 -9 -1 -6%
Independence, 673 -3 26 -1 11%
Kansas City, 660-662 0 10 0 4%
Liberal, 679 -2 11 -1 4%
Louisville, 400-402 -1 5 0 2%
Salina, 674 -3 -11 -1 -7%
Topeka, 664-666 -3 2 -1 -1%
Wichita, 670-672 -2 -6 -1 -4%