Page 25 - 2018 National Home Improvement
P. 25

2018 National Home Improvement Estimator, All Rights Reserved                                    Page 18


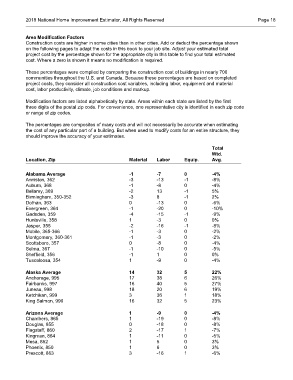
            Area Modification Factors
            Construction costs are higher in some cities than in other cities. Add or deduct the percentage shown
            on the following pages to adapt the costs in this book to your job site. Adjust your estimated total
            project cost by the percentage shown for the appropriate city in this table to find your total estimated
            cost. Where a zero is shown it means no modification is required.

            These percentages were compiled by comparing the construction cost of buildings in nearly 700
            communities throughout the U.S. and Canada. Because these percentages are based on completed
            project costs, they consider all construction cost variables, including labor, equipment and material
            cost, labor productivity, climate, job conditions and markup.

            Modification factors are listed alphabetically by state. Areas within each state are listed by the first
            three digits of the postal zip code. For convenience, one representative city is identified in each zip code
            or range of zip codes.

            The percentages are composites of many costs and will not necessarily be accurate when estimating
            the cost of any particular part of a building. But when used to modify costs for an entire structure, they
            should improve the accuracy of your estimates.

                                                                                          Total
                                                                                          Wtd.
            Location, Zip                              Material    Labor      Equip.      Avg.


            Alabama Average                            -1          -7         0           -4%
            Anniston, 362                              -3          -13        -1          -8%
            Auburn, 368                                -1          -8         0           -4%
            Bellamy, 369                               -2          13         -1          5%
            Birmingham, 350-352                        -3          8          -1          2%
            Dothan, 363                                0           -13        0           -6%
            Evergreen, 364                             -1          -20        0           -10%
            Gadsden, 359                               -4          -15        -1          -9%
            Huntsville, 358                            1           -3         0           0%
            Jasper, 355                                -2          -16        -1          -8%
            Mobile, 365-366                            -1          -3         0           -2%
            Montgomery, 360-361                        -1          -3         0           -2%
            Scottsboro, 357                            0           -8         0           -4%
            Selma, 367                                 -1          -10        0           -5%
            Sheffield, 356                             -1          1          0           0%
            Tuscaloosa, 354                            1           -9         0           -4%

            Alaska Average                             14          32         5           22%
            Anchorage, 995                             17          38         6           26%
            Fairbanks, 997                             16          40         5           27%
            Juneau, 998                                18          20         6           19%
            Ketchikan, 999                             3           36         1           18%
            King Salmon, 996                           16          32         5           23%

            Arizona Average                            1           -9         0           -4%
            Chambers, 865                              1           -19        0           -8%
            Douglas, 855                               0           -18        0           -8%
            Flagstaff, 860                             2           -17        1           -7%
            Kingman, 864                               1           -11        0           -5%
            Mesa, 852                                  1           5          0           3%
            Phoenix, 850                               1           6          0           3%
            Prescott, 863                              3           -16        1           -6%
   20   21   22   23   24   25   26   27   28   29   30