
Page 139 - eProceeding for IRSTC2017 and RESPeX2017
P. 139
Masliana & M.Zainal Akmal/ JOJAPS – JOURNAL ONLINE JARINGAN COT POLIPD
This questionnaire form consists of 27 items which are divided into several sections. According to Kamarudin & Roslim
(1990), the purpose of the questionnaire was to obtain accurate and complete information.
3.2.1 Method of Data Analysis
All items were analyzed using Statistical Package for Social Science (SPSS) version 16.0. Descriptive data analysis methods
are used to describe information related to research questions. To achieve that goal, mean analysis and standard deviation are
used to illustrate the descriptive score distribution of each item. To measure the level, respondents' responses were classified into
three mean scores with three levels of low, medium and high as in Table 1 below.
Table 1: Interpretation Min Score
Mean Score Interpretation
1.00 -2.33 Low
2.34 - 3.67 Moderate
3.68 - 5.00 High
Source: Wiersma & Stephen (2005)
Furthermore, the correlation statistical analysis was used to identify the strength of relationships among the variables in this
study by using the strength scale proposed by Healey (2008) in Table 2 as below.
Table 2: Correlation Value
Correlation value (r) Interpretation
below 0.1 Weak relation
0.10 - 0.30 Moderate relation
0.30 - above Strong relation
Source: Healey (2008)
3.3 A pilot study
Pilot study was conducted to test the reliability of the instrument that was built and to make sure the questions in the
questionnaire were in line with the respondent situation. According to Mohd Salleh and Zaidatun (2001), reliability is a measure
of the ability of a research instrument to measure the problem of consistency every time it is used at different times, places and
samples. The maximum value of the reliability coefficient is 1. If the coefficient value is less than 0.6, then it may be considered
that the instrument used in the study has low reliability value.
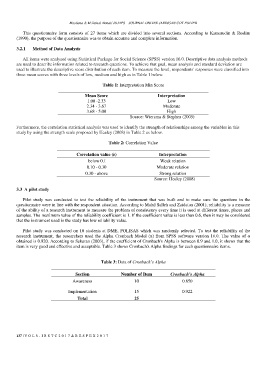
Pilot study was conducted on 10 students at DME, POLISAS which was randomly selected. To test the reliability of the
research instrument, the researchers used the Alpha Cronbach Model (α) from SPSS software version 16.0. The value of α
obtained is 0.920. According to Sekaran (2003), if the coefficient of Cronbach's Alpha is between 0.9 and 1.0, it shows that the
item is very good and effective and acceptable. Table 3 shows Cronbach's Alpha findings for each questionnaire items.
Table 3: Data of Cronbach’s Alpha
Section Number of Item Cronbach’s Alpha
Awareness 10 0.850
Implementation 15 0.922
Total 25
137 | V O L 8 - I R S T C 2 0 1 7 & R E S P E X 2 0 1 7