
Page 140 - eProceeding for IRSTC2017 and RESPeX2017
P. 140
Masliana & M.Zainal Akmal/ JOJAPS – JOURNAL ONLINE JARINGAN COT POLIPD
4.0 Result and Discussions
Data obtained through questionnaire from respondents were collected and analyzed by using SPSS 16.0 program. The
findings of demographic factors were analyzed using frequency and percentage and translated into table form. The objectives of
the study are expressed in mean and standard deviation. Data analysis is made and arranged according to the objectives and
questions of the study.
4.1 Respondents’s Profile
Respondents’ demographic information, which consists of program of study, gender and semester of the students, is shown in
Table 4 to Table 6.
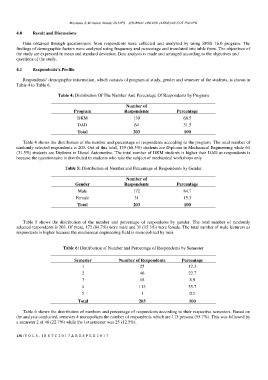
Table 4: Distribution Of The Number And Percentage Of Respondents by Program
Number of
Program Respondents Percentage
DKM 139 68.5
DAD 64 31.5
Total 203 100
Table 4 shows the distribution of the number and percentage of respondents according to the program. The total number of
randomly selected respondents is 203. Out of this total, 139 (68.5%) students are Diploma in Mechanical Engineering while 64
(31.5%) students are Diploma in Diesel Automotive. The total number of DKM students is higher than DAD as respondents is
because the questionnaire is distributed to students who take the subject of mechanical workshops only
Table 5: Distribution of Number and Percentage of Respondents by Gender
Number of
Gender Respondents Percentage
Male 172 84.7
Female 31 15.3
Total 203 100
Table 5 shows the distribution of the number and percentage of respondents by gender. The total number of randomly
selected respondents is 203. Of these, 172 (84.7%) were male and 31 (15.3%) were female. The total number of male lecturers as
respondents is higher because the mechanical engineering field is monopolized by men.
Table 6: Distribution of Number and Percentage of Respondents by Semester
Semester Number of Respondents Percentage
1 25 12.3
2 46 22.7
3 18 8.9
4 113 55.7
5 1 0.5
Total 203 100
Table 6 shows the distribution of numbers and percentage of respondents according to their respective semesters. Based on
the analysis conducted, semester 4 monopolizes the number of respondents which are 113 persons (55.7%). This was followed by
a semester 2 of 46 (22.7%) while the 1st semester was 25 (12.3%).
138 | V O L 8 - I R S T C 2 0 1 7 & R E S P E X 2 0 1 7