
Page 552 - eProceeding for IRSTC2017 and RESPeX2017
P. 552
th
Nuradilah Binti Abas / IRSTC 2017 – 4 INTERNATIONAL SEMINAR : INNOVATION for RESEARCH SCIENCE, TECHNOLOGY & CULTURE
One Way Analysis of Variance (ANOVA)
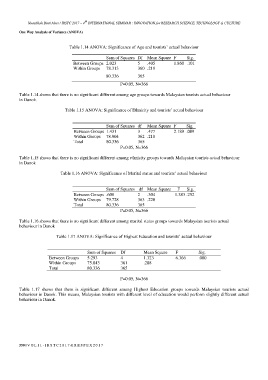
Table 1.14 ANOVA: Significance of Age and tourists’ actual behaviour
Sum of Squares Df Mean Square F Sig.
Between Groups 2.023 5 .405 1.860 .101
Within Groups 78.313 360 .218
80.336 365
P=0.05, N=366
Table 1.14 shows that there is no significant different among age groups towards Malaysian tourists actual behaviour
in Danok.
Table 1.15 ANOVA: Significance of Ethnicity and tourists’ actual behaviour
Sum of Squares df Mean Square F Sig.
Between Groups 1.431 3 .477 2.189 .089
Within Groups 78.904 362 .218
Total 80.336 365
P=0.05, N=366
Table 1.15 shows that there is no significant different among ethnicity groups towards Malaysian tourists actual behaviour
in Danok
Table 1.16 ANOVA: Significance of Marital status and tourists’ actual behaviour
Sum of Squares df Mean Square F Sig.
Between Groups .608 2 .304 1.383 .252
Within Groups 79.728 363 .220
Total 80.336 365
P=0.05, N=366
Table 1.16 shows that there is no significant different among marital status groups towards Malaysian tourists actual
behaviour in Danok
Table 1.17 ANOVA: Significance of Highest Education and tourists’ actual behaviour
Sum of Squares Df Mean Square F Sig.
Between Groups 5.293 4 1.323 6.366 .000
Within Groups 75.043 361 .208
Total 80.336 365
P=0.05, N=366
Table 1.17 shows that there is significant different among Highest Education groups towards Malaysian tourists actual
behaviour in Danok. This means, Malaysian tourists with different level of education would perform slightly different actual
behaviour in Danok.
550 | V O L 1 1 - I R S T C 2 0 1 7 & R E S P E X 2 0 1 7