
Page 3 - Golden Belt Bank
P. 3
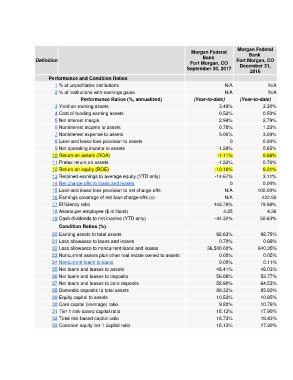
Morgan Federal
                                                                                 Morgan Federal          Bank
                Definition                                                            Bank          Fort Morgan, CO
                                                                                 Fort Morgan, CO
                                                                               September 30, 2017    December 31,
                                                                                                         2016
                          Performance and Condition Ratios
                        1  % of unprofitable institutions                                      N/A               N/A
                        2  % of institutions with earnings gains                               N/A               N/A
                                                  Performance Ratios (%, annualized)   (Year-to-date)   (Year-to-date)
                        3  Yield on earning assets                                           3.46%             3.30%
                        4  Cost of funding earning assets                                    0.52%             0.50%
                        5  Net interest margin                                               2.94%             2.79%
                        6  Noninterest income to assets                                      0.78%             1.23%
                        7  Noninterest expense to assets                                     5.05%             3.09%
                        8  Loan and lease loss provision to assets                               0             0.00%
                        9  Net operating income to assets                                   -1.29%             0.65%
                       10   Return on assets (ROA)                                          -1.11%             0.68%
                       11   Pretax return on assets                                         -1.33%             0.76%
                       12   Return on equity (ROE)                                         -10.16%             6.31%
                       13   Retained earnings to average equity (YTD only)                 -14.67%             3.11%
                                                                                                 0             0.00%
                       14   Net charge-offs to loans and leases
                       15   Loan and lease loss provision to net charge-offs                   N/A           100.00%
                       16   Earnings coverage of net loan charge-offs (x)                      N/A            422.50
                       17   Efficiency ratio                                              142.79%             79.98%
                       18   Assets per employee ($ millions)                                  4.25               4.36
                       19   Cash dividends to net income (YTD only)                        -44.32%            50.63%
                          Condition Ratios (%)
                       20   Earning assets to total assets                                 92.63%             92.78%
                       21   Loss allowance to loans and leases                               0.70%             0.69%
                       22   Loss allowance to noncurrent loans and leases               36,500.00%           640.35%
                       23   Noncurrent assets plus other real estate owned to assets         0.00%             0.05%
                                                                                             0.00%             0.11%
                       24   Noncurrent loans to loans
                       25   Net loans and leases to assets                                 48.41%             46.03%
                       26   Net loans and leases to deposits                               56.08%             53.77%
                       27   Net loans and leases to core deposits                          58.90%             64.53%
                       28   Domestic deposits to total assets                              86.33%             85.60%
                       29   Equity capital to assets                                       10.53%             10.85%
                       30   Core capital (leverage) ratio                                    9.80%            10.76%
                       31   Tier 1 risk-based capital ratio                                18.13%             17.90%
                       32   Total risk-based capital ratio                                 18.73%             18.43%
                       33   Common equity tier 1 capital ratio                             18.13%             17.90%