
Page 7 - Reeftankers - Annexure B Sasfin
P. 7
PART A
ECONOMIC AND MARKET OVERVIEW
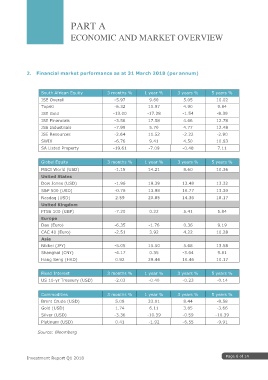
2. Financial market performance as at 31 March 2018 (per annum)
South African Equity 3 months % 1 year % 3 years % 5 years %
JSE Overall -5.97 9.60 5.05 10.02
Top40 -6.32 10.97 4.90 9.84
JSE Gold -13.00 -17.28 -1.54 -8.39
JSE Financials -3.56 17.58 4.66 12.78
JSE Industrials -7.99 5.70 4.77 12.48
JSE Resources -2.64 11.52 -2.22 -2.90
SWIX -6.76 9.41 4.50 10.83
SA Listed Property -19.61 -7.09 -0.48 7.11
Global Equity 3 months % 1 year % 3 years % 5 years %
MSCI World (USD) -1.15 14.21 8.60 10.36
United States
Dow Jones (USD) -1.96 19.39 13.48 13.32
S&P 500 (USD) -0.76 13.98 10.77 13.30
Nasdaq (USD) 2.59 20.85 14.36 18.17
United Kingdom
FTSE 100 (GBP) -7.20 0.22 5.41 5.84
Europe
Dax (Euro) -6.35 -1.76 0.36 9.19
CAC 40 (Euro) -2.51 3.92 4.22 10.28
Asia
Nikkei (JPY) -5.05 15.50 5.68 13.58
Shanghai (CNY) -4.17 0.35 -3.64 9.81
Hang Seng (HKD) 0.92 29.44 10.46 10.17
Fixed Interest 3 months % 1 year % 3 years % 5 years %
US 10-yr Treasury (USD) -2.03 -0.40 -0.23 -0.14
Commodities 3 months % 1 year % 3 years % 5 years %
Brent Crude (USD) 5.08 33.01 8.44 -8.58
Gold (USD) 1.74 6.11 3.85 -3.66
Silver (USD) -3.36 -10.39 -0.59 -10.39
Platinum (USD) 0.41 -1.92 -6.55 -9.91
Source: Bloomberg
Page 6 of 14
Investment Report Q1 2018