Page 14 - Cardiac Electrophysiology | A Modeling and Imaging Approach
P. 14

P. 14
        P . 14
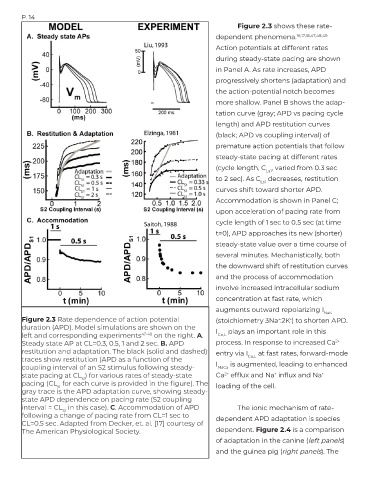
                                                                                Figure 2.3 shows these rate-
                                                                        dependent phenomena.       16,17,18,47,48,49
                                                                        Action potentials at different rates
                                                                        during steady-state pacing are shown
                                                                        in Panel A. As rate increases, APD

                                                                        progressively shortens (adaptation) and
                                                                        the action-potential notch becomes
                                                                        more shallow. Panel B shows the adap-
                                                                        tation curve (gray; APD vs pacing cycle

                                                                        length) and APD restitution curves
                                                                        (black; APD vs coupling interval) of
                                                                        premature action potentials that follow
                                                                        steady-state pacing at different rates

                                                                        (cycle length, C , varied from 0.3 sec
                                                                                         Ls1
                                                                        to 2 sec). As C  decreases, restitution
                                                                                       Ls1
                                                                        curves shift toward shorter APD.
                                                                        Accommodation is shown in Panel C;

                                                                        upon acceleration of pacing rate from
                                                                        cycle length of 1 sec to 0.5 sec (at time
                                                                        t=0), APD approaches its new (shorter)
                                                                        steady-state value over a time course of

                                                                        several minutes. Mechanistically, both
                                                                        the downward shift of restitution curves
                                                                        and the process of accommodation
                                                                        involve increased intracellular sodium

                                                                        concentration at fast rate, which
                                                                        augments outward repolarizing I     NaK
        Figure 2.3 Rate dependence of action potential                  (stoichiometry 3Na :2K ) to shorten APD.
                                                                                                 +
                                                                                             +
        duration (APD). Model simulations are shown on the              I    plays an important role in this
        left and corresponding experiments      47-49  on the right. A.   Ca,L
                                                                                                                2+
        Steady state AP at CL=0.3, 0.5, 1 and 2 sec. B. APD             process. In response to increased Ca
        restitution and adaptation. The black (solid and dashed)        entry via I    at fast rates, forward-mode
        traces show restitution (APD as a function of the                          Ca,L
        coupling interval of an S2 stimulus following steady-           I NaCa  is augmented, leading to enhanced
                                                                                                           +
                                                                           2+
        state pacing at CL ) for various rates of steady-state          Ca  efflux and Na  influx and Na
                                                                                            +
                            s1
        pacing (CL  for each curve is provided in the figure). The      loading of the cell.
                    s1
        gray trace is the APD adaptation curve, showing steady-
        state APD dependence on pacing rate (S2 coupling
        interval = CL  in this case). C. Accommodation of APD                   The ionic mechanism of rate-
                      S1
        following a change of pacing rate from CL=1 sec to              dependent APD adaptation is species
        CL=0.5 sec. Adapted from Decker, et. al. [17] courtesy of
        The American Physiological Society.                             dependent. Figure 2.4 is a comparison
                                                                        of adaptation in the canine (left panels)
                                                                        and the guinea pig (right panels). The
   9   10   11   12   13   14   15   16   17   18   19