
Page 190 - ACFE Fraud Reports 2009_2020
P. 190
2 How occupational Fraud is committed
Comparison of Occupational Fraud Schemes by Frequency
once we have subdivided asset misappropriations into nine distinct subcategories, our analysis of particular
fraud schemes takes on more meaning. We can study these particular forms of asset misappropriation along-
side the categories of corruption and financial statement fraud. This analysis gives us a better understanding
of the specific ways in which employees defraud their employers.
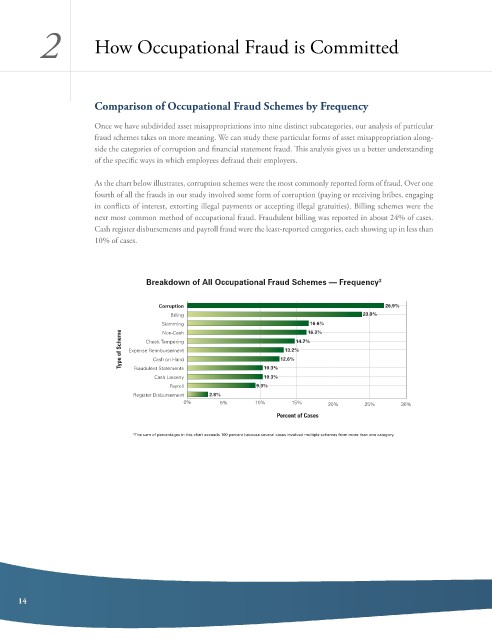
as the chart below illustrates, corruption schemes were the most commonly reported form of fraud. over one
fourth of all the frauds in our study involved some form of corruption (paying or receiving bribes, engaging
in conflicts of interest, extorting illegal payments or accepting illegal gratuities). billing schemes were the
next most common method of occupational fraud. Fraudulent billing was reported in about 24% of cases.
cash register disbursements and payroll fraud were the least-reported categories, each showing up in less than
10% of cases.
Breakdown of All Occupational Fraud Schemes — Frequency 3
Corruption 26.9%
Billing 23.9%
Skimming 16.3%
16.6%
Type of Scheme Expense Reimbursement 12.6% 14.7%
Non-Cash
Check Tampering
13.2%
Cash on Hand
Fraudulent Statements
10.3%
Cash Larceny 10.3%
Payroll 9.3%
Register Disbursement 2.8%
0% 5% 10% 15% 20% 25% 30%
Percent of Cases
3 The sum of percentages in this chart exceeds 100 percent because several cases involved multiple schemes from more than one category.
14