Page 315 - ACFE Fraud Reports 2009_2020
P. 315
Red Flags Based on perpetrator’s position
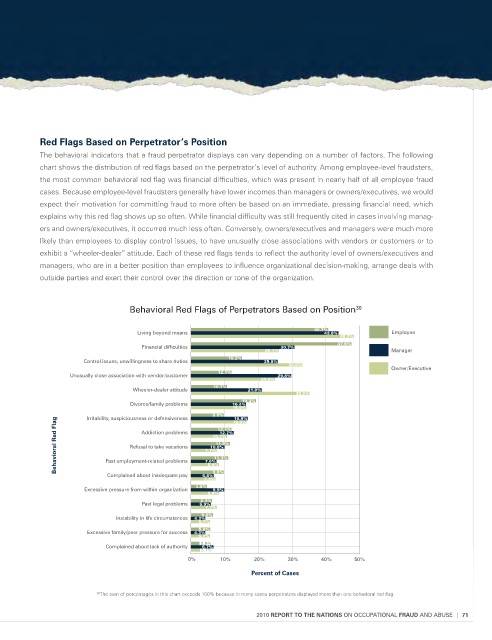
           The behavioral indicators that a fraud perpetrator displays can vary depending on a number of factors. The following
           chart shows the distribution of red flags based on the perpetrator’s level of authority. Among employee-level fraudsters,
           the most common behavioral red flag was financial difficulties, which was present in nearly half of all employee fraud
           cases. Because employee-level fraudsters generally have lower incomes than managers or owners/executives, we would
           expect their motivation for committing fraud to more often be based on an immediate, pressing financial need, which
           explains why this red flag shows up so often. While financial difficulty was still frequently cited in cases involving manag-
           ers and owners/executives, it occurred much less often. Conversely, owners/executives and managers were much more
           likely than employees to display control issues, to have unusually close associations with vendors or customers or to
           exhibit a “wheeler-dealer” attitude. Each of these red flags tends to reflect the authority level of owners/executives and
           managers, who are in a better position than employees to influence organizational decision-making, arrange deals with
           outside parties and exert their control over the direction or tone of the organization.


                                 behavioral Red Flags of Perpetrators based on Position 30


                                                                              40.7%
                                   Living beyond means                          43.8%            Employee
                                                                                    48.3%
                                                                                    47.6%
                                    Financial difficulties            30.7%
                                                                  26.1%                          Manager
                                                         15.2%
                      Control issues, unwillingness to share duties  25.8%
                                                                        33.0%
                                                                                                 Owner/Executive
                  Unusually close association with vendor/customer  12.1%  29.8%
                                                                 24.9%
                                                     10.7%
                                  Wheeler-dealer attitude     21.0%
                                                                          35.2%
                                                            19.3%
                                 Divorce/family problems  16.4%
                                                          16.5%
                                                     9.8%  16.5%
                      Irritability, suspiciousness or defensiveness
                                                          16.9%
               Behavioral Red Flag  Past employment-related problems  7.7% 10.7%
                                                      12.1%
                                    Addiction problems
                                                       12.7%
                                                      11.6%
                                 Refusal to take vacations
                                                     10.0%
                                                     11.1%
                                                   7.6%
                                                    8.4%
                           Complained about inadequate pay  6.8% 9.8%
                                                   7.3%
                                                 4.8%
                      Excessive pressure from within organization  9.9%
                                                    8.4%
                                                  6.3%
                                    Past legal problems  5.9%
                                                   7.7%
                                                  6.6%
                             Instability in life circumstances  4.3%
                                                  5.7%
                                                  5.8%
                      Excessive family/peer pressure for success  4.3%
                                                  5.7%
                                                  2.6%
                           Complained about lack of authority  6.7%
                                                  2.7%
                                               0%      10%     20%      30%     40%     50%
                                                               Percent of Cases
                         30 The sum of percentages in this chart exceeds 100% because in many cases perpetrators displayed more than one behavioral red flag.
                                                                2010 RepoRt to the NAtioNs ON OccuPATIONAl FRAUD ANd AbuSE  |  71

