Page 601 - ACFE Fraud Reports 2009_2020
P. 601
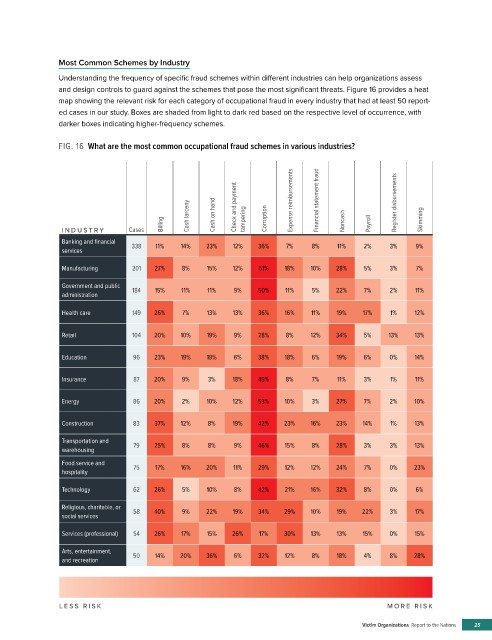
Most Common Schemes by Industry
               Understanding the frequency of specific fraud schemes within different industries can help organizations assess
               and design controls to guard against the schemes that pose the most significant threats. Figure 16 provides a heat
               map showing the relevant risk for each category of occupational fraud in every industry that had at least 50 report-
               ed cases in our study. Boxes are shaded from light to dark red based on the respective level of occurrence, with
               darker boxes indicating higher-frequency schemes.


               FIG. 16  What are the most common occupational fraud schemes in various industries?


                                               Cash larceny  Cash on hand  Check and payment   tampering  Corruption  Expense reimbursements  Financial statement fraud  Register disbursements  Skimming

                                         Billing                                     Noncash  Payroll
                I N  D  U  S T R  Y  Cases
                Banking and financial    338  11%  14%  23%  12%  36%  7%    8%     11%   2%     3%    9%
                services
                Manufacturing    201   27%    8%    15%   12%   51%    18%   10%   28%    5%     3%    7%

                Government and public    184  15%  11%  11%  9%  50%   11%   5%    22%    7%     2%    11%
                administration

                Health care      149   26%    7%    13%   13%   36%    16%   11%    19%   17%    1%    12%


                Retail           104   20%   10%    19%   9%    28%    8%    12%   34%    5%    13%    13%

                Education         96   23%   19%    19%   6%    38%    18%   6%     19%   6%    0%     14%

                Insurance         87   20%    9%    3%    18%   45%    8%    7%     11%   3%     1%    11%


                Energy            86   20%    2%    10%   12%   53%    10%   3%    27%    7%     2%    10%

                Construction      83   37%   12%    8%    19%   42%    23%   16%   23%    14%    1%    13%

                Transportation and
                warehousing       79   25%    8%    8%    9%    46%    15%   8%    28%    3%     3%    13%
                Food service and
                hospitality       75   17%   16%    20%   11%   29%    12%   12%   24%    7%     0%    23%
                Technology        62   26%    5%    10%   8%    42%    21%   16%   32%    8%     0%    6%

                Religious, charitable, or
                social services   58   40%    9%    22%   19%   34%    29%   10%    19%   22%    3%    17%

                Services (professional)  54  26%  17%  15%  26%  17%   30%   13%    13%   15%    0%    15%

                Arts, entertainment,
                and recreation    50   14%   20%    36%   6%    32%    12%   8%     18%   4%     8%   28%


                LESS RISK                                                                       MORE RISK

                                                                                           Victim Organizations  Report to the Nations     25

