
Page 81 - ACFE Fraud Reports 2009_2020
P. 81
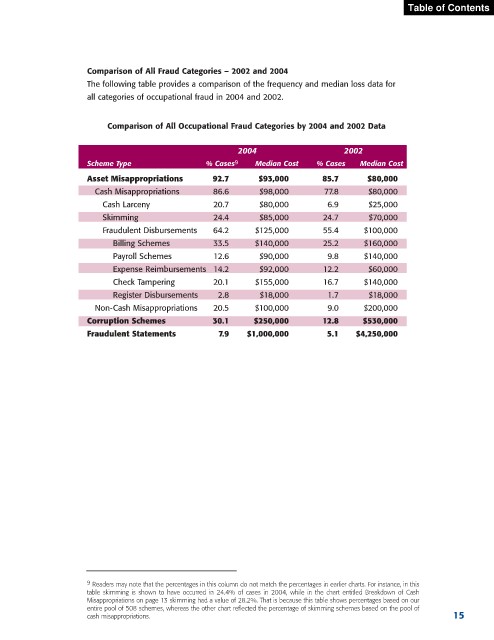
Table of Contents


                       Comparison of All Fraud Categories – 2002 and 2004
                       The following table provides a comparison of the frequency and median loss data for
                       all categories of occupational fraud in 2004 and 2002.


                            Comparison of All Occupational Fraud Categories by 2004 and 2002 Data


                                                            2004                      2002
                       Scheme Type                  % Cases 9   Median Cost    % Cases    Median Cost
                       Asset Misappropriations        92.7       $93,000         85.7       $80,000
                         Cash Misappropriations       86.6       $98,000         77.8       $80,000
                          Cash Larceny                20.7       $80,000          6.9       $25,000
                          Skimming                    24.4       $85,000         24.7       $70,000
                          Fraudulent Disbursements    64.2      $125,000         55.4      $100,000
                             Billing Schemes          33.5      $140,000         25.2      $160,000
                             Payroll Schemes          12.6       $90,000          9.8      $140,000
                             Expense Reimbursements 14.2         $92,000         12.2       $60,000
                             Check Tampering          20.1      $155,000         16.7      $140,000
                             Register Disbursements    2.8       $18,000          1.7       $18,000
                         Non-Cash Misappropriations   20.5      $100,000          9.0      $200,000
                       Corruption Schemes             30.1      $250,000         12.8      $530,000
                       Fraudulent Statements           7.9    $1,000,000          5.1    $4,250,000


                       9  Readers may note that the percentages in this column do not match the percentages in earlier charts. For instance, in this
                       table skimming is shown to have occurred in 24.4% of cases in 2004, while in the chart entitled Breakdown of Cash
                       Misappropriations on page 13 skimming had a value of 28.2%. That is because this table shows percentages based on our
                       entire pool of 508 schemes, whereas the other chart reflected the percentage of skimming schemes based on the pool of
                       cash misappropriations.                                                                   15