
Page 5 - THe ROI of Using A PEO
P. 5
How We Did the Research
How We Did The Research
We offered organizations (both PEO clients and organizations that do not use PEOs) a free employee survey. To take advantage of this offer, each participating organization was required to complete a detailed enrollment form that included a variety of measures that could be used for purposes of our research comparing PEO clients to benchmarks for other organizations on HR-related expenditures as well as a variety of other factors we also included in the enrollment form. The cost-based comparison served as the basis for the ROI estimate noted above.
A total of 132 PEO clients (represented by at least 10 different PEOs) submitted data as part of this survey/research initiative. We also received data from 44 organizations that are not PEO clients.
Full details about our research methods are included in the Methodology section at the end of this paper.
How ROI Was Calculated
The estimated ROI of 27.2 percent per year was derived by calculating PEO-related cost savings per employee (FTE) from the five expenditure categories noted above and comparing it with PEO-related costs per worksite employee (WSE) from the 2018 NAPEO Financial Ratio & Operating Statistics Survey. The average cost savings from using a PEO is $1,775 per year per employee, while the average PEO cost per employee (gross profit per WSE in the FROS) is $1,395, yielding an annual ROI of 27.2 percent.2
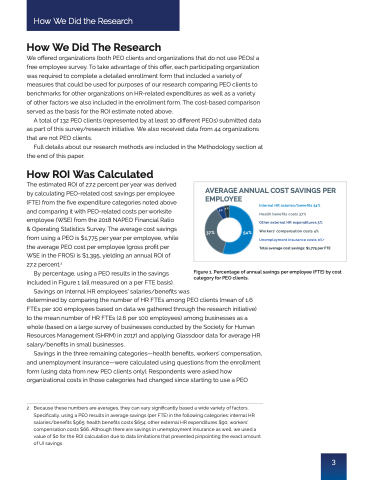
By percentage, using a PEO results in the savings included in Figure 1 (all measured on a per FTE basis).
Figure 1. Percentage of annual savings per employee (FTE) by cost category for PEO clients.
AVERAGE ANNUAL COST SAVINGS PER EMPLOYEE
4% $965
37% $965
Internal HR salaries/benefits 54%
Health benefits costs 37%
Other external HR expenditures 5%
Workers’ compensation costs 4%
Unemployment insurance costs 0%+
Total average cost savings: $1,775 per FTE
5%
54%
Savings on internal HR employees’ salaries/benefits was
determined by comparing the number of HR FTEs among PEO clients (mean of 1.6 FTEs per 100 employees based on data we gathered through the research initiative) to the mean number of HR FTEs (2.6 per 100 employees) among businesses as a whole (based on a large survey of businesses conducted by the Society for Human Resources Management (SHRM) in 2017) and applying Glassdoor data for average HR salary/benefits in small businesses.
Savings in the three remaining categories—health benefits, workers’ compensation, and unemployment insurance—were calculated using questions from the enrollment form (using data from new PEO clients only). Respondents were asked how organizational costs in those categories had changed since starting to use a PEO
2 Because these numbers are averages, they can vary significantly based a wide variety of factors. Specifically, using a PEO results in average savings (per FTE) in the following categories: internal HR salaries/benefits $965; health benefits costs $654; other external HR expenditures $90; workers’ compensation costs $66. Although there are savings in unemployment insurance as well, we used a value of $0 for the ROI calculation due to data limitations that prevented pinpointing the exact amount of UI savings.
3
