
Page 6 - THe ROI of Using A PEO
P. 6
Additional Sources of Value
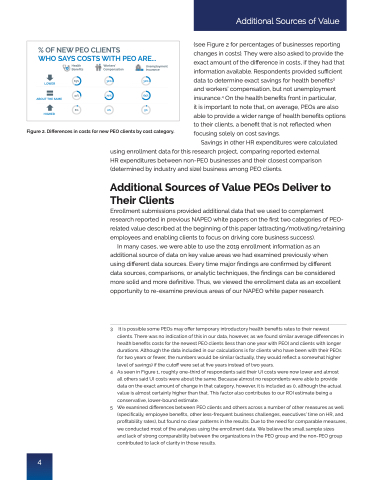
% OF NEW PEO CLIENTS
WHO SAYS COSTS WITH PEO ARE...
LOWER
ABOUT THE SAME
HIGHER
Health Benefits
63%
31%
Workers’ Unemployment Compensation Insurance
30% 30%
70% 65%
6% 0% 5%
Figure 2. Differences in costs for new PEO clients by cost category.
(see Figure 2 for percentages of businesses reporting changes in costs). They were also asked to provide the exact amount of the difference in costs, if they had that information available. Respondents provided sufficient data to determine exact savings for health benefits3 and workers’ compensation, but not unemployment insurance.4 On the health benefits front in particular,
it is important to note that, on average, PEOs are also able to provide a wider range of health benefits options to their clients, a benefit that is not reflected when focusing solely on cost savings.
Savings in other HR expenditures were calculated using enrollment data for this research project, comparing reported external
HR expenditures between non-PEO businesses and their closest comparison (determined by industry and size) business among PEO clients.
Additional Sources of Value PEOs Deliver to
Their Clients
Enrollment submissions provided additional data that we used to complement research reported in previous NAPEO white papers on the first two categories of PEO- related value described at the beginning of this paper (attracting/motivating/retaining employees and enabling clients to focus on driving core business success).
In many cases, we were able to use the 2019 enrollment information as an additional source of data on key value areas we had examined previously when using different data sources. Every time major findings are confirmed by different data sources, comparisons, or analytic techniques, the findings can be considered more solid and more definitive. Thus, we viewed the enrollment data as an excellent opportunity to re-examine previous areas of our NAPEO white paper research.
4
3
4
5
It is possible some PEOs may offer temporary introductory health benefits rates to their newest
clients. There was no indication of this in our data, however, as we found similar average differences in health benefits costs for the newest PEO clients (less than one year with PEO) and clients with longer durations. Although the data included in our calculations is for clients who have been with their PEOs for two years or fewer, the numbers would be similar (actually, they would reflect a somewhat higher level of savings) if the cutoff were set at five years instead of two years.
As seen in Figure 1, roughly one-third of respondents said their UI costs were now lower and almost
all others said UI costs were about the same. Because almost no respondents were able to provide data on the exact amount of change in that category, however, it is included as 0, although the actual value is almost certainly higher than that. This factor also contributes to our ROI estimate being a conservative, lower-bound estimate.
We examined differences between PEO clients and others across a number of other measures as well (specifically, employee benefits, other less-frequent business challenges, executives’ time on HR, and profitability rates), but found no clear patterns in the results. Due to the need for comparable measures, we conducted most of the analyses using the enrollment data. We believe the small sample sizes
and lack of strong comparability between the organizations in the PEO group and the non-PEO group contributed to lack of clarity in those results.
