
Page 7 - THe ROI of Using A PEO
P. 7
Additional Sources of Value
ANNUAL EMPLOYEE TURNOVER %
Voluntary
Involuntary
Total
All PEO Businesses Clients
29.9 19.4
19.0 9.9
48.9 29.3
Difference
-10.5 -9.1 -19.6
In particular, our 2019 analysis revealed the following four important findings:5
• There is notably lower employee turnover (both voluntary and involuntary) among PEO clients;
• There are higher rates of both employee growth and business revenue growth among PEO clients;
• Fewer PEO clients expressed moderate or major concern about hiring, retaining, and motivating employees; and
• New PEO clients often add a variety of new benefits for their employees, with life insurance, retirement plans, and health benefits the categories most frequently added by new PEO clients.
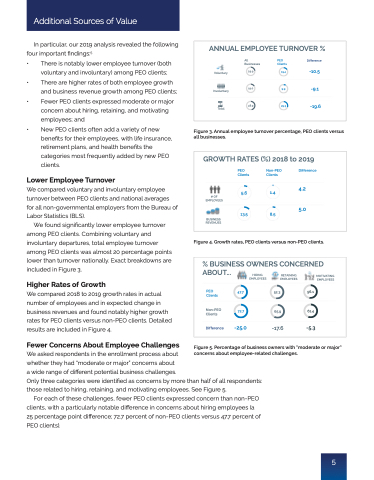
Lower Employee Turnover
We compared voluntary and involuntary employee turnover between PEO clients and national averages for all non-governmental employers from the Bureau of Labor Statistics (BLS).
We found significantly lower employee turnover among PEO clients. Combining voluntary and involuntary departures, total employee turnover among PEO clients was almost 20 percentage points lower than turnover nationally. Exact breakdowns are included in Figure 3.
Higher Rates of Growth
We compared 2018 to 2019 growth rates in actual number of employees and in expected change in business revenues and found notably higher growth rates for PEO clients versus non-PEO clients. Detailed results are included in Figure 4.
Fewer Concerns About Employee Challenges
We asked respondents in the enrollment process about
whether they had “moderate or major” concerns about
a wide range of different potential business challenges.
Only three categories were identified as concerns by more than half of all respondents: those related to hiring, retaining, and motivating employees. See Figure 5.
For each of these challenges, fewer PEO clients expressed concern than non-PEO clients, with a particularly notable difference in concerns about hiring employees (a 25 percentage point difference; 72.7 percent of non-PEO clients versus 47.7 percent of PEO clients).
Figure 3. Annual employee turnover percentage, PEO clients versus all businesses.
Figure 4. Growth rates, PEO clients versus non-PEO clients.
GROWTH RATES (%) 2018 to 2019
PEO Clients
Non-PEO Difference Clients
# OF EMPLOYEES
BUSINESS REVENUES
5.6 1.4 13.5 8.5
4.2
5.0
% BUSINESS OWNERS CONCERNED
ABOUT...
PEO 47.7 Clients
HIRING EMPLOYEES
RETAINING EMPLOYEES
52.3 56.1
65.9 61.4 -17.6 -5.3
MOTIVATING EMPLOYEES
Non-PEO Clients
72.7
Difference -25.0
Figure 5. Percentage of business owners with “moderate or major” concerns about employee-related challenges.
5
