
Page 9 - 2022 November Report
P. 9
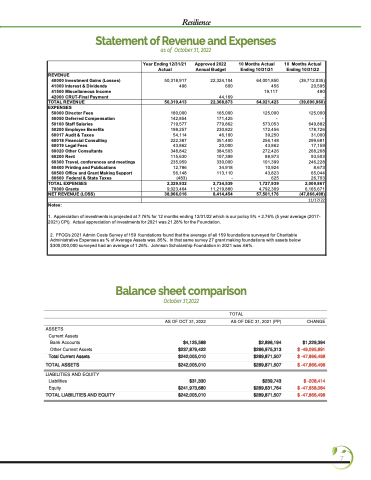
 Resilience
Statement of Revenue and Expenses
as of October 31, 2022
   Year Ending 12/31/21 Approved 2022 10 Months Actual 10 Months Actual Actual Annual Budget Ending 10/31/21 Ending 10/31/22
REVENUE
40000 Investment Gains (Losses) 41000 Interest & Dividends 41500 Miscellaneous Income 42000 CRUT-Final Payment
50,318,917 22,324,104 496 600
44,169
64,001,850 (39,712,035) 456 20,595 19,117 480 -
TOTAL REVENUE
50,319,413 22,368,873 64,021,423 (39,690,960)
EXPENSES
50000 Director Fees
50050 Deferred Compensation
50100 Staff Salaries
50200 Employee Benefits
60017 Audit & Taxes
60018 Financial Consulting
60019 Legal Fees
60020 Other Consultants
60200 Rent
60300 Travel, conferences and meetings 60400 Printing and Publications
60500 Office and Grant Making Support 60600 Federal & State Taxes
180,000 142,854 719,577 198,257
54,114 222,387 43,862 348,842 115,630 235,959 12,786 56,148 (483)
165,000 171,425 779,862 230,822
46,100 351,400 20,000 384,503 107,399 330,000 34,918 113,110 -
125,000 -
573,053 172,456 39,250 256,148 43,862 272,426 88,973 101,399 10,924 43,823 625
125,000 -
649,882 178,726 31,000 299,681 17,159 268,268 93,503 246,228 8,673 65,044 26,703
TOTAL EXPENSES 70000 Grants
2,329,932 2,734,539 1,727,939 2,009,867
9,023,464 11,219,880 4,792,309 6,165,671
NET REVENUE (LOSS)
38,966,016 8,414,454 57,501,176 (47,866,498)
 11/17/22
  Notes:
1. Appreciation of investments is projected at 7.76% for 12 months ending 12/31/22 which is our policy 5% + 2.76% (5 year average (2017- 2021) CPI). Actual appreciation of investments for 2021 was 21.28% for the Foundation.
2. FFOG's 2021 Admin Costs Survey of 159 foundations found that the average of all 159 foundations surveyed for Charitable Administrative Expenses as % of Average Assets was .85%. In that same survey 27 grant making foundations with assets below $300,000,000 surveyed had an average of 1.26%. Johnson Scholarship Foundation in 2021 was .66%.
          Johnson Scholarship Foundation Balance Sheet
Balance sheet comparison
As of October 31, 2022
    ASSETS Current Assets
Bank Accounts
Other Current Assets
Total Current Assets
TOTAL ASSETS
LIABILITIES AND EQUITY Liabilities
Equity
TOTAL LIABILITIES AND EQUITY
October 31,2022
AS OF OCT 31, 2022
$4,125,588 $237,879,422 $242,005,010
$242,005,010 $31,330
$241,973,680 $242,005,010
TOTAL
AS OF DEC 31, 2021 (PP)
$2,896,194 $286,975,313 $289,871,507
$289,871,507 $239,743
$289,631,764 $289,871,507
CHANGE
$1,229,394 $ -49,095,891 $ -47,866,498
$ -47,866,498 $ -208,414
$ -47,658,084 $ -47,866,498
       7
