
Page 8 - 2022 November Report
P. 8
November Report 2022
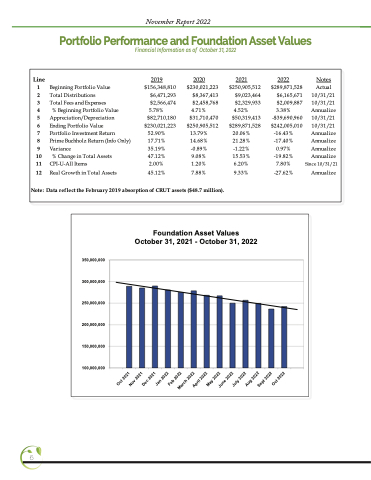
Portfolio Performance and Foundation Asset Values
FinancialInformationasof October31,2022
Line
1 Beginning Portfolio Value
2 Total Distributions
3 Total Fees and Expenses
4 % Beginning Portfolio Value
5 Appreciation/Depreciation $82,710,180
6 Ending Portfolio Value
7 Portfolio Investment Return
8 Prime Buchholz Return (Info Only)
9 Variance
10 % Change in Total Assets
11 CPI-U-All Items
12 Real Growth in Total Assets
$230,021,223 52.90% 17.71% 35.19% 47.12%
2.00% 45.12%
Note: Data reflect the February 2019 absorption of CRUT assets ($48.7 million).
2019 $156,348,810
2020 $230,021,223
$8,367,413
$2,458,768 4.71%
$31,710,470 $250,905,512
13.79% 14.68% -0.89% 9.08% 1.20% 7.88%
2021 $250,905,512
$9,023,464
$2,329,933 4.52%
$50,319,413 $289,871,528
20.06% 21.28% -1.22% 15.53% 6.20% 9.33%
2022 $289,871,528
$6,165,671 $2,009,887 3.38%
-$39,690,960 $242,005,010
-16.43% -17.40% 0.97% -19.82% 7.80% -27.62%
Notes Actual 10/31/21 10/31/21 Annualize 10/31/21 10/31/21 Annualize Annualize Annualize Annualize
Since 10/31/21 Annualize
$6,471,293
$2,566,474 5.78%
350,000,000 300,000,000 250,000,000 200,000,000 150,000,000 100,000,000
Oct 2021
Nov 2021
Dec 2021
Jan 2022
Feb 2022
May 2022
Aug 2022
March 2022
April 2022
June 2022
July 2022
Sept 2022
Oct 2022
Foundation Asset Values October 31, 2021 - October 31, 2022
6
