
Page 10 - 2022 June Report
P. 10
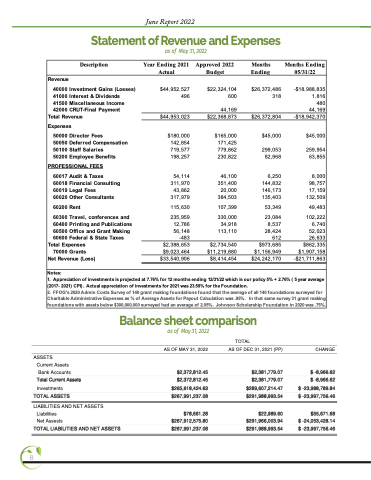
    June Report 2022
Statement of Revenue and Expenses
as of May 31, 2022
  Description Year Ending 2021 Approved 2022 Months Months Ending Actual Budget Ending 05/31/22
  Revenue
40000 Investment Gains (Losses) 41000 Interest & Dividends 41500 Miscellaneous Income 42000 CRUT-Final Payment
Total Revenue Expenses
50000 Director Fees
50050 Deferred Compensation 50100 Staff Salaries
50200 Employee Benefits
PROFESSIONAL FEES
60017 Audit & Taxes
60018 Financial Consulting 60019 Legal Fees
60020 Other Consultants
60200 Rent
60300 Travel, conferences and 60400 Printing and Publications 60500 Office and Grant Making 60600 Federal & State Taxes
Total Expenses 70000 Grants
Net Revenue (Loss)
$44,952,527 496
$44,953,023
$180,000 142, 854 719, 577 198, 257
54,114 311,970 43, 862 317, 979
115,630
235, 959 12, 786 56,148
-483 $2,388,653 $9,023,464 $33,540,906
$22,324,104 600
44, 169 $22, 368, 873
$165, 000 171, 425 779, 862 230, 822
46, 100 351, 400 20, 000 384, 503
107, 399
330, 000 34, 918 113,110
$2, 734, 540 $11,219,880 $8, 414, 454
$26,372,486 318
$26, 372, 804
$45, 000
299, 053 82, 968
6, 250 144, 832 146, 173 135, 403
53, 349
23, 084 8, 537 28, 424 612 $973, 685 $1,156,949 $24, 242, 170
-$18,988,835 1,816 480 44, 169 -$18,942,370
$45, 000
259, 954 63, 855
8, 000 98, 757 17, 159
132, 509 49, 483
102, 222 6, 740 52, 023 26, 633 $862, 335 $1,907,158 -$21,711,863
        Notes:
1. Appreciation of investments is projected at 7.76% for 12 months ending 12/31/22 which is our policy 5% + 2.76% ( 5 year average (2017- 2021) CPI). Actual appreciation of investments for 2021 was 23.59% for the Foundation.
2. FFOG's 2020 Admin Costs Survey of 140 grant making foundations found that the average of all 140 foundations surveyed for Charitable AdmTinihstreatoivedEoxprenseRs a.s %&ofVAivveriagenAsMset.s fJoroPhaynoust oCanlcuSlaticonhwoasla.9r5%s.hIinpthaFt soamuensudrvaey 31 grant making foundations with assets below $300,000,000 surveyed had an average of 2.05%. Johnson Scholarship Foundation in 2020 was .75%.
 ASSETS Current Assets
Bank Accounts
Total Current Assets Investments
TOTAL ASSETS
LIABILITIES AND NET ASSETS
Liabilities
Net Assests
TOTAL LIABILITIES AND NET ASSETS
as of May 31, 2022
AS OF MAY 31, 2022
$2,372,812.45 $2,372,812.45
$265,618,424.63 $267,991,237.08
$78,661.28 $267,912,575.80 $267,991,237.08
TOTAL
AS OF DEC 31, 2021 (PP)
$2,381,779.07 $2,381,779.07
$289,607,214.47 $291,988,993.54
$22,989.60 $291,966,003.94 $291,988,993.54
CHANGE
$ -8,966.62 $ -8,966.62
$ -23,988,789.84 $ -23,997,756.46
$55,671.68 $ -24,053,428.14 $ -23,997,756.46
Balance Sheet Comparison As of May 31, 2022
Balance sheet comparison
         8
