
Page 9 - 2022 June Report
P. 9
Resilience
Portfolio Performance and Foundation Asset Values
FinancialInformationasof May31,2022
Line 1
2
3
4
5 6 7 8 9 10
2019 $203,310,464
$6,471,293 $2,734,528
% Beginning Portfolio
Value
Appreciation/Depreciation $35,916,895
2020 $230,021,538
$8,367,423 $2,458,767
4.71%
$31,711,400 $234,531,092
13.79% 1.96% 1.20% 0.76%
2021 $234,531,092
$9,023,464 $2,336,067
5.81%
$46,098,370 $291,988,993
23.59% 29.40% 6.20% 23.20%
2022 $291,988,993
$1,907,158 $862,335
2.28%
-$21,711,863 $267,991,237
-17.85% -19.72% 8.50% -28.22%
Notes
Actual 5/31/22 5/31/22
Annualize
5/31/22
5/31/22 Annualize Annualize Since 5/31/21 Annualize
Beginning Portfolio Value Total Distributions
Total Fees and Expenses
Ending Portfolio Value Portfolio Investment Return
% Change in Total Assets CPI-U-All Items
Real Growth in Total Assets
$230,021,538 17.67% 13.14%
2.00% 11.14%
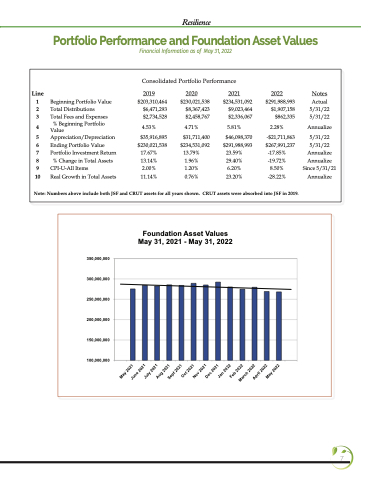
Consolidated Portfolio Performance
4.53%
Note: Numbers above include both JSF and CRUT assets for all years shown. CRUT assets were absorbed into JSF in 2019.
350,000,000 300,000,000 250,000,000 200,000,000 150,000,000 100,000,000
Foundation Asset Values May 31, 2021 - May 31, 2022
7
May 2021 June 2021
July 2021 Aug 2021
Sept 2021
Oct 2021
Nov 2021 Dec 2021
Jan 2022 Feb 2022
March 2022 April 2022
May 2022
