
Page 475 - Fluid, Electrolyte, and Acid-Base Disorders in Small Animal Practice
P. 475
Fluid, Electrolyte, and Acid-Base Disturbances in Liver Disease 463
160 6.0 135 1.045 60 3.5
155 5.5 130 1.040 50 3.0
150 5.0 125 1.035 40
2.5
145 120 1.030 30
4.5
140 115 1.025 25 2.0
4.0
135 110 1.020 20 1.5
3.5
130 105 1.015 15
1.0
125 3.0 100 1.010 10
120 2.5 95 1.005 5 0.5
Urine specific
Sodium mEq/L Potassium mEq/L Chloride mEq/L BUN mg/dL Creatinine mg/dL
gravity
4.0 6.0 500 5.0
250 4.0
3.5 5.5
200 3.0 Cirrhosis and ascites
5.0 Cirrhosis without ascites
3.0 175 2.0
4.5 150 1.0
2.5
4.0 125 0.5
2.0 100 0.4
3.5
75 0.3
1.5
3.0 50 0.2
1.0 2.5 25 0.1
Albumin g/dL Globulins g/dL Fibrinogen g/dL Total bilirubin mg/dL
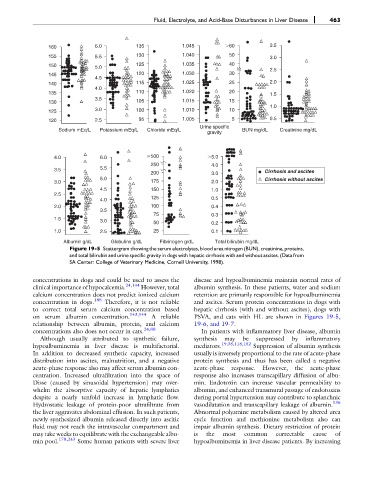
Figure 19-5 Scattergram showing the serum electrolytes, blood urea nitrogen (BUN), creatinine, proteins,
and total bilirubin and urine specific gravity in dogs with hepatic cirrhosis with and without ascites. (Data from
SA Center: College of Veterinary Medicine, Cornell University, 1998).
concentrations in dogs and could be used to assess the disease and hypoalbuminemia maintain normal rates of
clinical importance of hypocalcemia. 24,144 However, total albumin synthesis. In these patients, water and sodium
calcium concentration does not predict ionized calcium retention are primarily responsible for hypoalbuminemia
concentration in dogs. 185 Therefore, it is not reliable and ascites. Serum protein concentrations in dogs with
to correct total serum calcium concentration based hepatic cirrhosis (with and without ascites), dogs with
143,144
on serum albumin concentration. A reliable PSVA, and cats with HL are shown in Figures 19-5,
relationship between albumin, protein, and calcium 19-6, and 19-7.
concentrations also does not occur in cats. 24,80 In patients with inflammatory liver disease, albumin
Although usually attributed to synthetic failure, synthesis may be suppressed by inflammatory
hypoalbuminemia in liver disease is multifactorial. mediators. 19,38,118,152 Suppression of albumin synthesis
In addition to decreased synthetic capacity, increased usually is inversely proportional to the rate of acute-phase
distribution into ascites, malnutrition, and a negative protein synthesis and thus has been called a negative
acute-phase response also may affect serum albumin con- acute-phase response. However, the acute-phase
centration. Increased ultrafiltration into the space of response also increases transcapillary diffusion of albu-
Disse (caused by sinusoidal hypertension) may over- min. Endotoxin can increase vascular permeability to
whelm the absorptive capacity of hepatic lymphatics albumin, and enhanced transmural passage of endotoxins
despite a nearly tenfold increase in lymphatic flow. during portal hypertension may contribute to splanchnic
Hydrostatic leakage of protein-poor ultrafiltrate from vasodilatation and transcapillary leakage of albumin. 136
the liver aggravates abdominal effusion. In such patients, Abnormal polyamine metabolism caused by altered urea
newly synthesized albumin released directly into ascitic cycle function and methionine metabolism also can
fluid may not reach the intravascular compartment and impair albumin synthesis. Dietary restriction of protein
may take weeks to equilibrate with the exchangeable albu- is the most common correctable cause of
min pool. 178,243 Some human patients with severe liver hypoalbuminemia in liver disease patients. By increasing