
Page 427 - Adams and Stashak's Lameness in Horses, 7th Edition
P. 427
Diagnostic Imaging 393
VetBooks.ir
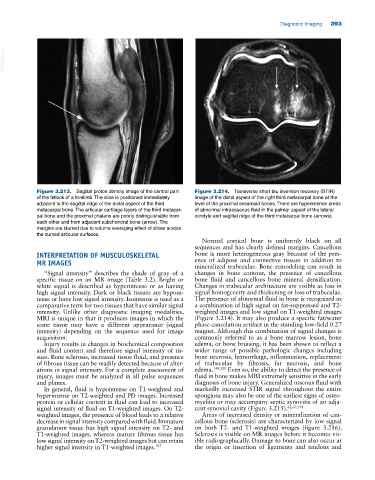
Figure 3.213. Sagittal proton density image of the central part Figure 3.214. Transverse short tau inversion recovery (STIR)
of the fetlock of a forelimb. The slice is positioned immediately image of the distal aspect of the right third metacarpal bone at the
adjacent to the sagittal ridge of the distal aspect of the third level of the proximal sesamoid bones. There are hyperintense areas
metacarpal bone. The articular cartilage layers of the third metacar of abnormal intraosseous fluid in the palmar aspect of the lateral
pal bone and the proximal phalanx are poorly distinguishable from condyle and sagittal ridge of the third metacarpal bone (arrows).
each other and from adjacent subchondral bone (arrow). The
margins are blurred due to volume averaging effect of slices across
the curved articular surfaces.
Normal cortical bone is uniformly black on all
sequences and has clearly defined margins. Cancellous
INTERPRETATION OF MUSCULOSKELETAL bone is more heterogeneous gray because of the pres
MR IMAGES ence of adipose and connective tissues in addition to
mineralized trabeculae. Bone remodeling can result in
“Signal intensity” describes the shade of gray of a changes in bone contour, the presence of cancellous
specific tissue on an MR image (Table 3.2). Bright or bone fluid and cancellous bone mineral densification.
white signal is described as hyperintense or as having Changes in trabecular architecture are visible as loss in
high signal intensity. Dark or black tissues are hypoin signal homogeneity and thickening or loss of trabeculae.
tense or have low signal intensity. Isointense is used as a The presence of abnormal fluid in bone is recognized as
comparative term for two tissues that have similar signal a combination of high signal on fat‐suppressed and T2‐
intensity. Unlike other diagnostic imaging modalities, weighted images and low signal on T1‐weighted images
MRI is unique in that it produces images in which the (Figure 3.214). It may also produce a specific fat/water
same tissue may have a different appearance (signal phase cancelation artifact in the standing low‐field 0.27
intensity) depending on the sequence used for image magnet. Although this combination of signal changes is
acquisition. commonly referred to as a bone marrow lesion, bone
Injury results in changes in biochemical composition edema, or bone bruising, it has been shown to reflect a
and fluid content and therefore signal intensity of tis wider range of possible pathologic changes including
sues. Bone sclerosis, increased tissue fluid, and presence bone necrosis, hemorrhage, inflammation, replacement
of fibrous tissue can be readily detected because of alter of trabeculae by fibrosis, fat necrosis, and bone
ations in signal intensity. For a complete assessment of edema. 148,200 Even so, the ability to detect the presence of
injury, images must be analyzed in all pulse sequences fluid in bone makes MRI extremely sensitive in the early
and planes. diagnosis of bone injury. Generalized osseous fluid with
In general, fluid is hypointense on T1‐weighted and markedly increased STIR signal throughout the entire
hyperintense on T2‐weighted and PD images. Increased spongiosa may also be one of the earliest signs of osteo
protein or cellular content in fluid can lead to increased myelitis or may accompany septic synovitis of an adja
signal intensity of fluid on T1‐weighted images. On T2‐ cent synovial cavity (Figure 3.215). 62,67,191
weighted images, the presence of blood leads to a relative Areas of increased density or mineralization of can
decrease in signal intensity compared with fluid. Immature cellous bone (sclerosis) are characterized by low signal
granulation tissue has high signal intensity on T2‐ and on both T2‐ and T1‐weighted images (figure 3.216).
T1‐weighted images, whereas mature fibrous tissue has Sclerosis is visible on MR images before it becomes vis
low signal intensity on T2‐weighted images but can retain ible radiographically. Damage to bone can also occur at
higher signal intensity in T1‐weighted images. 195 the origin or insertion of ligaments and tendons and