
Page 492 - Small Animal Clinical Nutrition 5th Edition
P. 492
508 Small Animal Clinical Nutrition
VetBooks.ir Box 27-3. Proposed Refinement of Body Condition Score (BCS) Classification of
Obese Dogs and Cats (BCS 5/5).
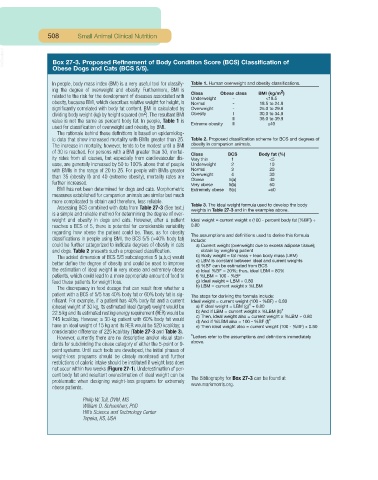
In people, body mass index (BMI) is a very useful tool for classify- Table 1. Human overweight and obesity classifications.
ing the degree of overweight and obesity. Furthermore, BMI is
2
Class Obese class BMI (kg/m )
related to the risk for the development of diseases associated with
Underweight - <18.5
obesity, because BMI, which describes relative weight for height, is Normal - 18.5 to 24.9
significantly correlated with body fat content. BMI is calculated by Overweight - 25.0 to 29.9
2
dividing body weight (kg) by height squared (m ).The resultant BMI Obesity I 30.0 to 34.9
II 35.0 to 39.9
value is not the same as percent body fat. In people, Table 1 is
Extreme obesity III ≥40
used for classification of overweight and obesity, by BMI.
The rationale behind these definitions is based on epidemiolog-
ic data that show increased mortality with BMIs greater than 25. Table 2. Proposed classification scheme for BCS and degrees of
The increase in mortality, however, tends to be modest until a BMI obesity in companion animals.
of 30 is reached. For persons with a BMI greater than 30, mortal-
Class BCS Body fat (%)
ity rates from all causes, but especially from cardiovascular dis- Very thin 1 <5
ease, are generally increased by 50 to 100% above that of people Underweight 2 10
with BMIs in the range of 20 to 25. For people with BMIs greater Normal 3 20
Overweight 4 30
than 35 (obesity II) and 40 (extreme obesity), mortality rates are
Obese 5(a) 40
further increased. Very obese 5(b) 50
BMI has not been determined for dogs and cats. Morphometric Extremely obese 5(c) ≥60
measures established for companion animals are similar but much
more complicated to obtain and therefore, less reliable.
Table 3. The ideal weight formula used to develop the body
Assessing BCS combined with data from Table 27-3 (See text.)
weights in Table 27-3 and in the examples above.
is a simple and reliable method for determining the degree of over-
weight and obesity in dogs and cats. However, after a patient Ideal weight = current weight x (100 - percent body fat [%BF]) ÷
reaches a BCS of 5, there is potential for considerable variability 0.80
regarding how obese the patient could be. Thus, as for obesity
The assumptions and definitions used to derive this formula
classifications in people using BMI, the BCS 5/5 (>40% body fat) include:
could be further categorized to indicate degrees of obesity in cats a) Current weight (overweight due to excess adipose tissue);
and dogs. Table 2 presents such a proposed classification. obtain by weighing patient
The added dimension of BCS 5/5 subcategories 5 (a,b,c) would b) Body weight = fat mass + lean body mass (LBM)
c) LBM is constant between ideal and current weights
better define the degree of obesity and could be used to improve
d) %BF can be estimated from BCS
the estimation of ideal weight in very obese and extremely obese e) Ideal %BF = 20%; thus, ideal LBM = 80%
patients, which could lead to a more appropriate amount of food to f) %LBM = 100 - %BF
feed these patients for weight loss. g) Ideal weight = LBM ÷ 0.80
h) LBM = current weight x %LBM
The discrepancy in food dosage that can result from whether a
patient with a BCS of 5/5 has 40% body fat or 60% body fat is sig- The steps for deriving the formula include:
nificant. For example, if a patient has 40% body fat and a current Ideal weight = current weight (100 - %BF) ÷ 0.80
(obese) weight of 30 kg, its estimated ideal (target) weight would be a) If ideal weight = LBM (g)* ÷ 0.80
22.5 kg and its estimated resting energy requirement (RER) would be b) And if LBM = current weight x %LBM (h)*
c) Then, ideal weight also = current weight x %LBM ÷ 0.80
745 kcal/day. However, a 30-kg patient with 60% body fat would d) And if %LBM also = 100 - %BF (f)*
have an ideal weight of 15 kg and its RER would be 520 kcal/day; a e) Then ideal weight also = current weight (100 - %BF) ÷ 0.80
considerable difference of 225 kcal/day (Table 27-3 and Table 3).
However, currently there are no descriptive and/or visual stan- *Letters refer to the assumptions and definitions immediately
above.
dards for subdividing the obese category of either the 5-point or 9-
point systems. Until such tools are developed, the initial phases of
weight-loss programs should be closely monitored and further
restrictions of caloric intake should be instituted if weight loss does
not occur within two weeks (Figure 27-1). Underestimation of per-
cent body fat and resultant overestimation of ideal weight can be The Bibliography for Box 27-3 can be found at
problematic when designing weight-loss programs for extremely www.markmorris.org.
obese patients.
Philip W. Toll, DVM, MS
William D. Schoenherr, PhD
Hill’s Science and Technology Center
Topeka, KS, USA