
Page 510 - Small Animal Clinical Nutrition 5th Edition
P. 510
526 Small Animal Clinical Nutrition
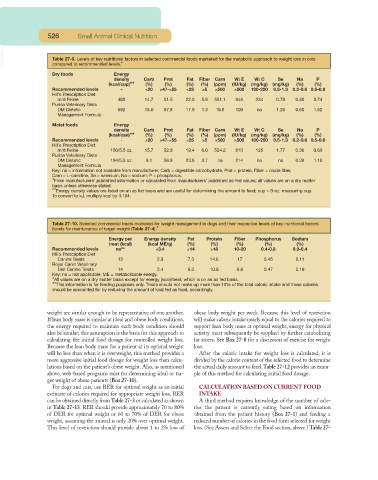
VetBooks.ir Table 27-9. Levels of key nutritional factors in selected commercial foods marketed for the metabolic approach to weight loss in cats
compared to recommended levels.*
Dry foods Energy
density Carb Prot Fat Fiber Carn Vit E Vit C Se Na P
(kcal/cup)** (%) (%) (%) (%) (ppm) (IU/kg) (mg/kg) (mg/kg) (%) (%)
Recommended levels - ≤20 ≥47-≤55 ≤25 ≥5 ≥500 ≥500 100-200 0.5-1.3 0.2-0.6 0.5-0.8
Hill’s Prescription Diet
m/d Feline 480 14.7 51.5 22.0 5.9 551.1 946 234 0.79 0.40 0.74
Purina Veterinary Diets
DM Dietetic 592 15.0 57.8 17.9 1.3 18.0 109 na 1.26 0.60 1.52
Management Formula
Moist foods Energy
density Carb Prot Fat Fiber Carn Vit E Vit C Se Na P
(kcal/can)** (%) (%) (%) (%) (ppm) (IU/kg) (mg/kg) (mg/kg) (%) (%)
Recommended levels - ≤20 ≥47-≤55 ≤25 ≥5 ≥500 ≥500 100-200 0.5-1.3 0.2-0.6 0.5-0.8
Hill’s Prescription Diet
m/d Feline 156/5.5 oz. 15.7 52.8 19.4 6.0 524.2 810 125 1.77 0.36 0.69
Purina Veterinary Diets
DM Dietetic 194/5.5 oz. 8.1 56.9 23.8 3.7 na 214 na na 0.39 1.10
Management Formula
Key: na = information not available from manufacturer, Carb = digestible carbohydrate, Prot = protein, Fiber = crude fiber,
Carn = L-carnitine, Se = selenium, Na = sodium; P = phosphorus.
*From manufacturers’ published information or calculated from manufacturers’ published as-fed values; all values are on a dry matter
basis unless otherwise stated.
**Energy density values are listed on an as fed basis and are useful for determining the amount to feed; cup = 8-oz. measuring cup.
To convert to kJ, multiply kcal by 4.184.
Table 27-10. Selected commercial treats marketed for weight management in dogs and their respective levels of key nutritional factors
(levels for maintenance of target weight (Table 27-4).*
Energy per Energy density Fat Protein Fiber Phosphorus Sodium
treat (kcal) (kcal ME/g) (%) (%) (%) (%) (%)
Recommended levels na** ≤3.4 ≤14 ≥18 10-20 0.4-0.8 0.2-0.4
Hill’s Prescription Diet
Canine Treats 13 2.9 7.3 14.6 17 0.45 0.11
Royal Canin Veterinary
Diet Canine Treats 14 3.4 6.3 10.9 6.8 0.47 0.19
Key: na = not applicable, ME = metabolizable energy.
*All values are on a dry matter basis except for energy (kcal)/treat, which is on an as fed basis.
**This information is for feeding purposes only. Treats should not make up more than 10% of the total caloric intake and these calories
should be accounted for by reducing the amount of kcal fed as food, accordingly.
weight are similar enough to be representative of one another. obese body weight per week. Because this level of restriction
If lean body mass is similar at ideal and obese body conditions, will make caloric intake nearly equal to the calories required to
the energy required to maintain each body condition should support lean body mass at optimal weight, energy for physical
also be similar; this assumption is the basis for this approach to activity must subsequently be supplied by further catabolizing
calculating the initial food dosage for controlled weight loss. fat stores. See Box 27-8 for a discussion of exercise for weight
Because the lean body mass for a patient at its optimal weight loss.
will be less than when it is overweight, this method provides a After the caloric intake for weight loss is calculated, it is
more aggressive initial food dosage for weight loss than calcu- divided by the calorie content of the selected food to determine
lations based on the patient’s obese weight. Also, as mentioned the actual daily amount to feed. Table 27-12 provides an exam-
above, web-based programs exist for determining ideal or tar- ple of this method for calculating initial food dosage.
get weight of obese patients (Box 27-10).
For dogs and cats, use RER for optimal weight as an initial CALCULATION BASED ON CURRENT FOOD
estimate of calories required for appropriate weight loss. RER INTAKE
can be obtained directly from Table 27-3 or calculated as shown A third method requires knowledge of the number of calo-
in Table 27-13. RER should provide approximately 70 to 80% ries the patient is currently eating based on information
of DER for optimal weight or 60 to 70% of DER for obese obtained from the patient history (Box 27-1) and feeding a
weight, assuming the animal is only 20% over optimal weight. reduced number of calories in the food form selected for weight
This level of restriction should provide about 1 to 2% loss of loss. (See Assess and Select the Food section, above.) Table 27-