
Page 2 - COPR- January2018
P. 2
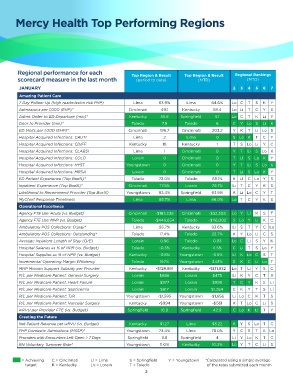
Mercy Health Top Performing Regions


        Regional performance for each                   Top Region & Result   Top Region & Result   Regional Rankings
        scorecard measure in the last month               (period to date)          (MTD)               (MTD)
         JANUARY                                                                                  2  3   4  5  6  7
         Amazing Patient Care
         7 Day Follow-Up (high readmission risk PHP)     Lima      63.9%       Lima      64.6%    Lo C   T  S  K  Y
         Admissions per 1,000 (EHP)*                   Cincinnati   49.1     Kentucky     58.4    Lo Li  T  C  Y  S
         Admit Order to ED Departure (min)*            Kentucky     55.6     Springfield   57     Lo C   T  K  Li  Y
         Door to Provider (min)*                        Toledo       7.9      Toledo       6      C  Y Lo   S  Li  K
         ED Visits per 1,000 (EHP)*                    Cincinnati   196.7    Cincinnati   203.2   Y  K   T  Li Lo  S
         Hospital Acquired Infections: CAUTI             Lima        2         Lima        0      S Lo K    T  C  Y
         Hospital Acquired Infections: CDIFF           Kentucky      18      Kentucky       1     T  S  Lo Li  Y  C
         Hospital Acquired Infections: CLABSI            Lima        1       Cincinnati    0      Y  T  Li  S  Lo K
         Hospital Acquired Infections: COLO             Lorain       0       Cincinnati    0      T  Li  S  Lo K  Y
         Hospital Acquired Infections: HYST           Youngstown     0       Cincinnati    0      Y  T  Li  S  Lo K
         Hospital Acquired Infections: MRSA             Lorain       0       Cincinnati    0      T  Li  S  Lo K  Y
         ED Patient Experience (Top Box%)*              Toledo     72.0%      Toledo      69.1%   K  Li  C Lo Y   S
         Inpatient Experience (Top Box%)*              Cincinnati   77.5%     Lorain      79.7%   Li  T  C  Y  K  S
         Likelihood to Recommend Provider (Top Box%)  Youngstown   93.4%     Springfield  93.9%   K  Li Lo C   Y  T
         MyChart Response Timeliness                     Lima      85.7%       Lima      86.0%    Lo T   C  Y  K  S
         Operational Excellence
         Agency FTE Use: Acute (vs. Budget)            Cincinnati  -$183,336  Cincinnati  -$52,303  Lo Y  Li  K  S  T
         Agency FTE Use: MHP (vs. Budget)               Toledo    -$446,634   Toledo    -$116,002  S Lo Y   Li  K  C
         Ambulatory POS Collections: Copay*              Lima      93.7%     Kentucky    93.6%    Li  S  T  Y  C Lo
         Ambulatory POS Collections: Outstanding*       Toledo      17.4%     Toledo      22.7%   K  Y Lo Li   C  S
         Average Inpatient Length of Stay (O/E)         Lorain      0.96      Toledo      0.93    Lo C  Li  S  Y  K
         Hospital Salaries as % of NPR (vs. Budget)     Toledo      -0.3%    Kentucky     -1.5%   C  Li  T  S  Lo Y
         Hospital Supplies as % of NPR (vs. Budget)    Kentucky     -0.8%   Youngstown    -3.5%   Li  K Lo C   S  T
         Incremental Operating Margin Efficiency        Toledo      167%    Youngstown    343%    S  K   C  Li Lo  T
         MHP Mission Support Subsidy per Provider      Kentucky   -$128,891  Kentucky   -$131,932  Lo T  Li  Y  S  C
         P/L per Medicare Patient: General Surgery      Lorain      $686      Lorain      $475    Li  K  Y  C  T  S
         P/L per Medicare Patient: Heart Failure        Lorain      $977      Lorain      $898    T  C   Y  K  S  Li
         P/L per Medicare Patient: Septicemia           Lorain      $817      Lorain     $1,264   C  K   Y  T  S  Li
         P/L per Medicare Patient: TJR                Youngstown   -$1,595  Youngstown   -$1,656  Li Lo C   K  T  S
         P/L per Medicare Patient: Vascular Surgery    Kentucky    -$994    Youngstown    -$561   K  T  Lo C   Li  S
         wRVU per Provider FTE (vs. Budget)           Springfield   16.9     Springfield  42.9    C Lo K    Li  T  Y
         Creating the Future
         Net Patient Revenue per wRVU (vs. Budget)     Kentucky     $1.27      Lima       $3.22   K  Y   S  Lo  T  C
         PHP Domestic Admissions (MSSP)*              Youngstown   73.4%       Lima      78.0%    Y  C   S  T  K Lo
         Providers with Encounters Left Open > 7 Days  Springfield   3.8     Springfield   4      Li  Y Lo K   T  C
         RN Voluntary Turnover Rate*                  Youngstown    11.0%    Kentucky     10.3%   Lo Y   T  C  Li  S


           =  Achieving    C = Cincinnati   Li = Lima   S = Springfield   Y = Youngstown  * Calculated using a simple average
            target     K = Kentucky    Lo = Lorain     T = Toledo                      of the rates submitted each month
                                                              2