
Page 16 - COPR- April2018
P. 16
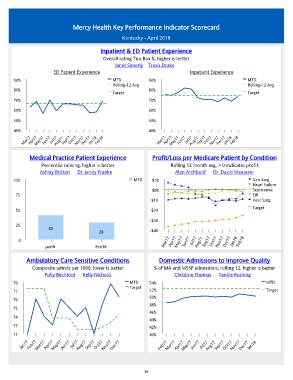
Mercy Health Key Performance Indicator Scorecard

                                                    Kentucky - April 2018

                                           Inpatient & ED Patient Experience
                                            Overall rating Top Box %, higher is better
                                                 Janet Simerly  Travis Drake
                       ED Patient Experience                                    Inpatient Experience
       90%                                      MTD            90%                                       MTD
                                                Rolling-12 Avg                                           Rolling-12 Avg
       80%                                                     80%
                                                Target                                                   Target
       70%                                                     70%

       60%                                                     60%

       50%                                                     50%
       40%                                                     40%
           Mar17  Apr17 May17  Jun17  Jul17 Aug17  Sep17  Oct17  Nov17 Dec17  Jan18  Feb18  Mar17  Apr17 May17  Jun17  Jul17 Aug17  Sep17  Oct17  Nov17 Dec17  Jan18  Feb18


             Medical Practice Patient Experience                 Profit/Loss per Medicare Patient by Condition
                  Percentile ranking, higher is better                  Rolling 12 month avg, > 0 indicates profit
                  Ashley Britton      Dr. Jenny Franke                      Alan Archbold      Dr. David Mauterer
       100                                               MTD     $1K                                       Gen Surg
                                                                                                           Heart Failure
                                                                 $0K                                       Septicemia
        75                                                                                                 TJR
                                                                -$1K                                       Vasc Surg
                                                                                                           Target
        50                                                      -$2K

                                                                -$3K
        25
                     40
                                          28                    -$4K
         0                                                           Mar17  Apr17  May17  Jun17  Jul17  Aug17  Sep17  Oct17  Nov17  Dec17  Jan18  Feb18
                    Jan18                Feb18


            Ambulatory Care Sensitive Conditions                   Domestic Admissions to Improve Quality
              Composite admits per 1000, lower is better         % of MA and MSSP admissions, rolling 12, higher is better
                     Polly Bechtold      Kelly Nicholls                   Christine Thomas      Tenille Rushing
       78                                              MTD     54%                                              MTD
                                                       Target
       77                                                      52%                                              Target
       76                                                      50%
                                                               48%
       75
                                                               46%
       74
                                                               44%
       73                                                      42%
       72                                                      40%
          Jan17  Feb17  Mar17  Apr17  May17  Jun17  Jul17  Aug17  Sep17  Oct17  Nov17  Dec17  Feb17  Mar17  Apr17  May17  Jun17  Jul17  Aug17  Sep17  Oct17  Nov17  Dec17  Jan18


                                                             16