
Page 21 - COPR- April2018
P. 21
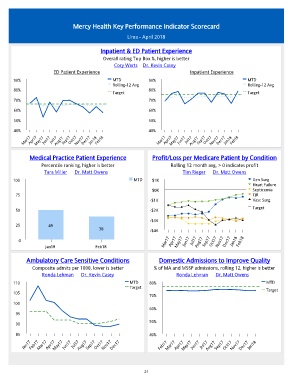
Mercy Health Key Performance Indicator Scorecard

                                                      Lima - April 2018

                                           Inpatient & ED Patient Experience
                                            Overall rating Top Box %, higher is better
                                                 Cory Werts  Dr. Kevin Casey
                       ED Patient Experience                                    Inpatient Experience
       90%                                      MTD            90%                                       MTD
                                                Rolling-12 Avg                                           Rolling-12 Avg
       80%                                                     80%
                                                Target                                                   Target
       70%                                                     70%

       60%                                                     60%

       50%                                                     50%
       40%                                                     40%
           Mar17  Apr17 May17  Jun17  Jul17 Aug17  Sep17  Oct17  Nov17 Dec17  Jan18  Feb18  Mar17  Apr17 May17  Jun17  Jul17 Aug17  Sep17  Oct17  Nov17 Dec17  Jan18  Feb18


             Medical Practice Patient Experience                 Profit/Loss per Medicare Patient by Condition
                  Percentile ranking, higher is better                  Rolling 12 month avg, > 0 indicates profit
                    Tara Miller      Dr. Matt Owens                            Tim Rieger      Dr. Matt Owens
       100                                               MTD     $1K                                       Gen Surg
                                                                                                           Heart Failure
                                                                 $0K                                       Septicemia
        75                                                                                                 TJR
                                                                -$1K                                       Vasc Surg
                                                                                                           Target
        50                                                      -$2K

                                                                -$3K
        25           49
                                          38                    -$4K

         0                                                           Mar17  Apr17  May17  Jun17  Jul17  Aug17  Sep17  Oct17  Nov17  Dec17  Jan18  Feb18
                    Jan18                Feb18


            Ambulatory Care Sensitive Conditions                   Domestic Admissions to Improve Quality
              Composite admits per 1000, lower is better         % of MA and MSSP admissions, rolling 12, higher is better
                    Ronda Lehman      Dr. Kevin Casey                      Ronda Lehman      Dr. Matt Owens
       110                                             MTD     80%                                              MTD
                                                       Target
       105                                                     70%                                              Target

       100
                                                               60%
        95
                                                               50%
        90
        85                                                     40%
           Jan17  Feb17  Mar17  Apr17 May17  Jun17  Jul17  Aug17  Sep17  Oct17  Nov17  Dec17  Feb17  Mar17  Apr17  May17  Jun17  Jul17  Aug17  Sep17  Oct17  Nov17  Dec17  Jan18


                                                             21