
Page 296 - Chemistry
P. 296
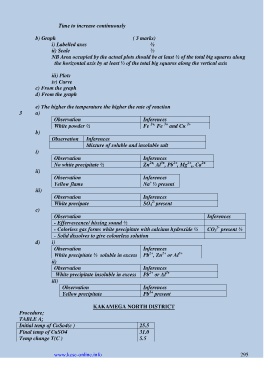
Time to increase continuously

                 b) Graph                                   ( 3 marks)
                        i) Labelled axes                            ½
                        ii) Scale                                   ½
                        NB Area occupied by the actual plots should be at least ½ of the total big squares along
                                    the horizontal axis by at least ½ of the total big squares along the vertical axis

                        iii) Plots
                        iv) Curve
                 c) From the graph
                 d) From the graph

                 e) The higher the temperature the higher the rate of reaction
          3      a)
                         Observation                             Inferences
                                                                                    2+
                                                                          3+
                                                                    2+,
                         White powder ½                          Fe   Fe   and Cu
                 b)
                        Observation    Inferences
                                       Mixture of soluble and insoluble salt
                 i)
                         Observation                             Inferences
                                                                    2+,
                                                                                    2+
                                                                                           2+
                                                                              2+
                                                                         3+
                         No white precipitate ½                  Zn  Al , Pb , Mg ,, Ca
                 ii)
                         Observation                             Inferences
                                                                    +
                         Yellow flame                            Na ½ present
                 iii)
                         Observation                             Inferences
                                                                     2-
                         White precipate                         SO 4 present
                 c)
                         Observation                                                         Inferences
                         - Effervescence/ hissing sound ½
                                                                                                 2-
                         - Colorless gas forms white precipitate with calcium hydroxide ½    CO 3  present ½
                         - Solid dissolves to give colourless solution
                 d)     i)
                         Observation                             Inferences
                                                                         2+
                                                                                3+
                                                                   2+
                         White precipitate ½  soluble in excess  Pb , Zn  or Al
                        ii)
                         Observation                             Inferences
                                                                   2+
                                                                           3+
                          White precipitate insoluble in excess   Pb  or Al
                        iii)
                             Observation                         Inferences
                                                                   2+
                             Yellow precipitate                  Pb  present

                                          KAKAMEGA NORTH DISTRICT
          Procedure;
          TABLE A;
          Initial temp of CuSo4(c )                            25.5
          Final temp of CuSO4                                  31.0
          Temp change T(C )                                    5.5

                         www.kcse-online.info                                                               295