
Page 14 - UKZN MIMI Report 2025
P. 14
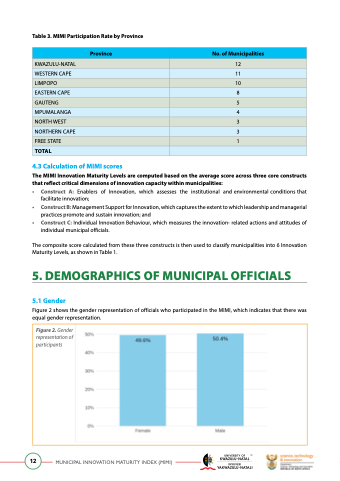
Table 3. MIMI Participation Rate by Province
 Province
 No. of Municipalities
 KWAZULU-NATAL
 12
 WESTERN CAPE
 11
 LIMPOPO
 10
 EASTERN CAPE
  8
 GAUTENG
5
 MPUMALANGA
 4
 NORTH WEST
  3
 NORTHERN CAPE
3
 FREE STATE
 1
 TOTAL
     4.3 Calculation of MIMI scores
The MIMI Innovation Maturity Levels are computed based on the average score across three core constructs that reflect critical dimensions of innovation capacity within municipalities:
• Construct A: Enablers of Innovation, which assesses the institutional and environmental conditions that
facilitate innovation;
• Construct B: Management Support for Innovation, which captures the extent to which leadership and managerial
practices promote and sustain innovation; and
• Construct C: Individual Innovation Behaviour, which measures the innovation- related actions and attitudes of
individual municipal officials.
The composite score calculated from these three constructs is then used to classify municipalities into 6 Innovation Maturity Levels, as shown in Table 1.
5. DEMOGRAPHICS OF MuNICIPAL OFFICIALS
5.1 Gender
Figure 2 shows the gender representation of officials who participated in the MIMI, which indicates that there was equal gender representation.
  12
MUNICIPAL INNOVATION MATURITY INDEX (MIMI)
  Figure 2. Gender representation of participants
