
Page 15 - UKZN MIMI Report 2025
P. 15
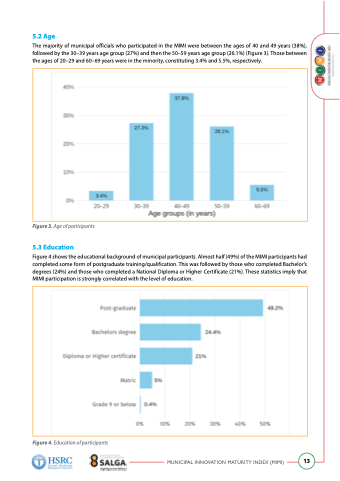
 5.2 Age
The majority of municipal officials who participated in the MIMI were between the ages of 40 and 49 years (38%), followed by the 30–39 years age group (27%) and then the 50–59 years age group (26.1%) (Figure 3). Those between the ages of 20–29 and 60–69 years were in the minority, constituting 3.4% and 5.5%, respectively.
Figure 3. Age of participants 5.3 Education
Figure 4 shows the educational background of municipal participants. Almost half (49%) of the MIMI participants had completed some form of postgraduate training/qualification. This was followed by those who completed Bachelor’s degrees (24%) and those who completed a National Diploma or Higher Certificate (21%). These statistics imply that MIMI participation is strongly correlated with the level of education.
    Figure 4. Education of participants
MUNICIPAL INNOVATION MATURITY INDEX (MIMI)
13
