
Page 17 - UKZN MIMI Report 2025
P. 17
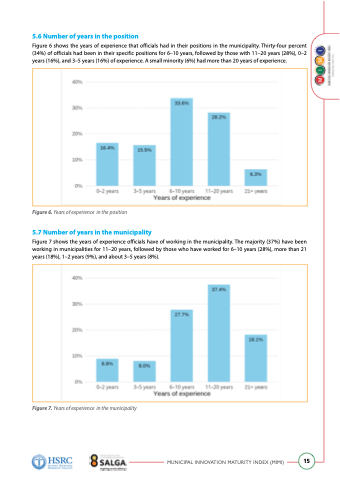
 5.6 Number of years in the position
Figure 6 shows the years of experience that officials had in their positions in the municipality. Thirty-four percent (34%) of officials had been in their specific positions for 6–10 years, followed by those with 11–20 years (28%), 0–2 years (16%), and 3–5 years (16%) of experience. A small minority (6%) had more than 20 years of experience.
Figure 6. Years of experience in the position
5.7 Number of years in the municipality
Figure 7 shows the years of experience officials have of working in the municipality. The majority (37%) have been working in municipalities for 11–20 years, followed by those who have worked for 6–10 years (28%), more than 21 years (18%), 1–2 years (9%), and about 3–5 years (8%).
Figure 7. Years of experience in the municipality
    MUNICIPAL INNOVATION MATURITY INDEX (MIMI)
15
