
Page 16 - UKZN MIMI Report 2025
P. 16
5.4 Departments/units
Table 4 shows the departments/units within municipalities where officials were based. Nineteen percent (19%) of MIMI participants were from the Technical/Infrastructure/Engineering departments, with 16% from the Economic Development and Planning units, 14% from Corporate Services, 13% from the Office of the Municipal Manager, 6% from Financial Services, 5% from Community Services, and 4% from Environmental units.
Table 4. Department where officials are based
Department/unit
N
Percent
Technical Services / Infrastructure Services / Engineering Services
44
18.6%
Economic Development and Planning
37
15.7%
Other
35
14.8%
Corporate Services
34
14.4%
Office of the Municipal Manger
31
13.1%
Financial Services /Treasury
15
6.4%
Community Services
11
4.7%
Environment
10
4.2%
Public Safety / Law Enforcement
6
2.5%
Municipal Entity
4
1.7%
Health Services
3
1.3%
Customer Relations Management
2
0.8%
Office of the Mayor
2
0.8%
Office of the Speaker
2
0.8%
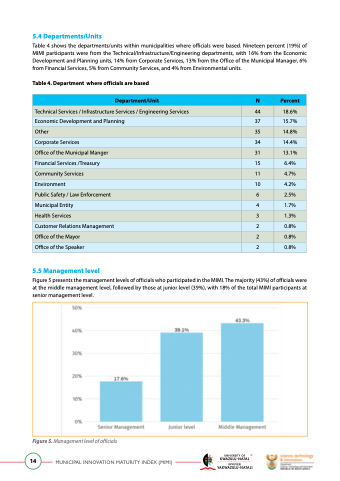
5.5 Management level
Figure 5 presents the management levels of officials who participated in the MIMI. The majority (43%) of officials were at the middle management level, followed by those at junior level (39%), with 18% of the total MIMI participants at senior management level.
Figure 5. Management level of officials
14
MUNICIPAL INNOVATION MATURITY INDEX (MIMI)
