
Page 131 - Six Sigma Advanced Tools for Black Belts and Master Black Belts
P. 131
Char Count= 0
2:57
August 31, 2006
JWBK119-09
116 Computing Process Capability Indices for Nonnormal Data
0.8
lognormal (0.0, 0.3)
0.7
lognormal (0.0, 0.5)
0.6
0.5
PDF , f(x) 0.4
0.3
0.2
0.1
0 1 2 3 4 5
x
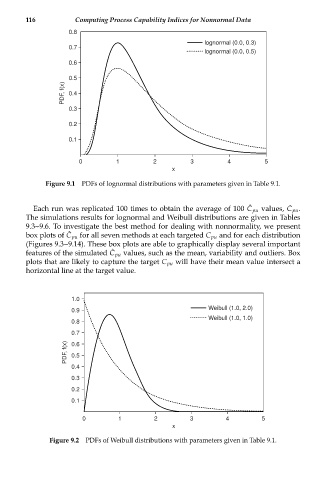
Figure 9.1 PDFs of lognormal distributions with parameters given in Table 9.1.
ˆ
¯
Each run was replicated 100 times to obtain the average of 100 C pu values, C pu .
The simulations results for lognormal and Weibull distributions are given in Tables
9.3--9.6. To investigate the best method for dealing with nonnormality, we present
ˆ
box plots of C pu for all seven methods at each targeted C pu and for each distribution
(Figures 9.3--9.14). These box plots are able to graphically display several important
ˆ
features of the simulated C pu values, such as the mean, variability and outliers. Box
plots that are likely to capture the target C pu will have their mean value intersect a
horizontal line at the target value.
1.0
0.9 Weibull (1.0, 2.0)
Weibull (1.0, 1.0)
0.8
0.7
PDF, f(x) 0.6
0.5
0.4
0.3
0.2
0.1
0 1 2 3 4 5
x
Figure 9.2 PDFs of Weibull distributions with parameters given in Table 9.1.