
Page 130 - Six Sigma Advanced Tools for Black Belts and Master Black Belts
P. 130
August 31, 2006
Char Count= 0
2:57
JWBK119-09
Simulation Study 115
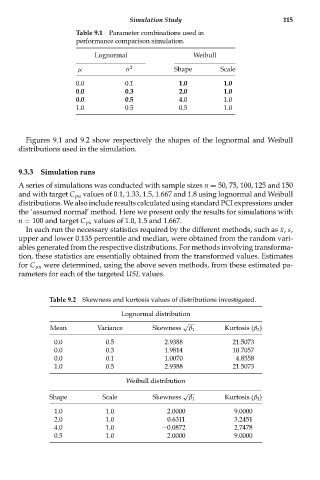
Table 9.1 Parameter combinations used in
performance comparison simulation.
Lognormal Weibull
μ σ 2 Shape Scale
0.0 0.1 1.0 1.0
0.0 0.3 2.0 1.0
0.0 0.5 4.0 1.0
1.0 0.5 0.5 1.0
Figures 9.1 and 9.2 show respectively the shapes of the lognormal and Weibull
distributions used in the simulation.
9.3.3 Simulation runs
A series of simulations was conducted with sample sizes n = 50, 75, 100, 125 and 150
and with target C pu values of 0.1, 1.33, 1.5, 1.667 and 1.8 using lognormal and Weibull
distributions. We also include results calculated using standard PCI expressions under
the ‘assumed normal’ method. Here we present only the results for simulations with
n = 100 and target C pu values of 1.0, 1.5 and 1.667.
In each run the necessary statistics required by the different methods, such as ¯x, s,
upper and lower 0.135 percentile and median, were obtained from the random vari-
ables generated from the respective distributions. For methods involving transforma-
tion, these statistics are essentially obtained from the transformed values. Estimates
for C pu were determined, using the above seven methods, from these estimated pa-
rameters for each of the targeted USL values.
Table 9.2 Skewness and kurtosis values of distributions investigated.
Lognormal distribution
√
Mean Variance Skewness β 1 Kurtosis (β 2 )
0.0 0.5 2.9388 21.5073
0.0 0.3 1.9814 10.7057
0.0 0.1 1.0070 4.8558
1.0 0.5 2.9388 21.5073
Weibull distribution
√
Shape Scale Skewness β 1 Kurtosis (β 2 )
1.0 1.0 2.0000 9.0000
2.0 1.0 0.6311 3.2451
4.0 1.0 −0.0872 2.7478
0.5 1.0 2.0000 9.0000