
Page 151 - Six Sigma Advanced Tools for Black Belts and Master Black Belts
P. 151
Char Count= 0
2:57
August 31, 2006
JWBK119-10
136 Process Capability Analysis for Non-Normal Data with MINITAB
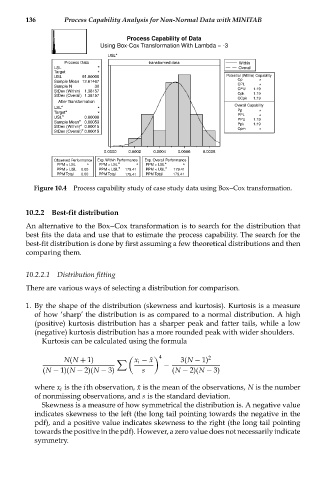
Process Capability of Data
Using Box-Cox Transformation With Lambda = -3
USL
Process Data transformed data Within
LSL Overall
Target
USL 91.00000 Potential (Within) Capability
Sample Mean 12.61467 Cp
Sample N 30 CPL 1.19
CPU
StDev (Within) 1.38157
StDev (Overall) 1.38157 Cpk 1.19
1.19
CCpk
After Transformation
LSL Overall Capability
Target Pp
PPL
USL 0.00000 PPU 1.19
Sample Mean 0.00053 Ppk 1.19
StDev (Within) 0.00015 Cpm
StDev (Overall) 0.00015
0.0000 0.0002 0.0004 0.0006 0.0008
Observed Performance Exp. Within Performance Exp. Overall Performance
PPM < LSL PPM > LSL PPM > LSL
PPM > USL 0.00 PPM < USL 179.41 PPM < USL 179.41
PPM Total 0.00 PPM Total 179.41 PPM Total 179.41
Figure 10.4 Process capability study of case study data using Box--Cox transformation.
10.2.2 Best-fit distribution
An alternative to the Box--Cox transformation is to search for the distribution that
best fits the data and use that to estimate the process capability. The search for the
best-fit distribution is done by first assuming a few theoretical distributions and then
comparing them.
10.2.2.1 Distribution fitting
There are various ways of selecting a distribution for comparison.
1. By the shape of the distribution (skewness and kurtosis). Kurtosis is a measure
of how ‘sharp’ the distribution is as compared to a normal distribution. A high
(positive) kurtosis distribution has a sharper peak and fatter tails, while a low
(negative) kurtosis distribution has a more rounded peak with wider shoulders.
Kurtosis can be calculated using the formula
N(N + 1) x i − ¯x 4 3(N − 1) 2
−
(N − 1)(N − 2)(N − 3) s (N − 2)(N − 3)
where x i is the ith observation, ¯x is the mean of the observations, N is the number
of nonmissing observations, and s is the standard deviation.
Skewness is a measure of how symmetrical the distribution is. A negative value
indicates skewness to the left (the long tail pointing towards the negative in the
pdf), and a positive value indicates skewness to the right (the long tail pointing
towards the positive in the pdf). However, a zero value does not necessarily indicate
symmetry.