
Page 157 - Six Sigma Advanced Tools for Black Belts and Master Black Belts
P. 157
Char Count= 0
2:57
August 31, 2006
JWBK119-10
142 Process Capability Analysis for Non-Normal Data with MINITAB
USL
16 24 32 40 48 56 64 72
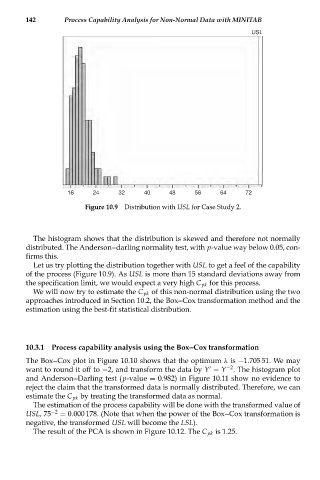
Figure 10.9 Distribution with USL for Case Study 2.
The histogram shows that the distribution is skewed and therefore not normally
distributed. The Anderson--darling normality test, with p-value way below 0.05, con-
firms this.
Let us try plotting the distribution together with USL to get a feel of the capability
of the process (Figure 10.9). As USL is more than 15 standard deviations away from
the specification limit, we would expect a very high C pk for this process.
We will now try to estimate the C pk of this non-normal distribution using the two
approaches introduced in Section 10.2, the Box--Cox transformation method and the
estimation using the best-fit statistical distribution.
10.3.1 Process capability analysis using the Box--Cox transformation
The Box--Cox plot in Figure 10.10 shows that the optimum λ is −1.705 51. We may
−2
want to round it off to −2, and transform the data by Y = Y . The histogram plot
and Anderson--Darling test (p-value = 0.982) in Figure 10.11 show no evidence to
reject the claim that the transformed data is normally distributed. Therefore, we can
estimate the C pk by treating the transformed data as normal.
The estimation of the process capability will be done with the transformed value of
USL,75 −2 = 0.000 178. (Note that when the power of the Box--Cox transformation is
negative, the transformed USL will become the LSL).
The result of the PCA is shown in Figure 10.12. The C pk is 1.25.