Page 161 - Six Sigma Advanced Tools for Black Belts and Master Black Belts
P. 161

August 31, 2006
                               Char Count= 0
                         2:57
 JWBK119-10
        146       Process Capability Analysis for Non-Normal Data with MINITAB
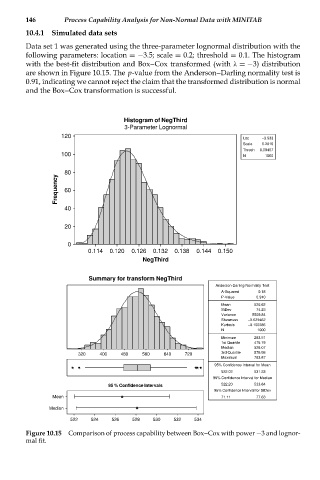
        10.4.1  Simulated data sets
        Data set 1 was generated using the three-parameter lognormal distribution with the
        following parameters: location =−3.5; scale = 0.2; threshold = 0.1. The histogram
        with the best-fit distribution and Box--Cox transformed (with λ =−3) distribution
        are shown in Figure 10.15. The p-value from the Anderson--Darling normality test is
        0.91, indicating we cannot reject the claim that the transformed distribution is normal
        and the Box--Cox transformation is successful.


                                  Histogram of NegThird
                                   3-Parameter Lognormal
                  120                                              Loc  −3.533
                                                                   Scale  0.2016
                                                                   Thresh  0.09457
                  100                                              N     1000

                  80
                Frequency  60


                  40

                  20

                   0
                         0.114  0.120  0.126  0.132  0.138  0.144  0.150
                                        NegThird

                         Summary for transform NegThird
                                                           Anderson-Darling Normality Test
                                                             A-Squared  0.18
                                                             P-Value  0.910
                                                             Mean     526.62
                                                             StDev    74.23
                                                             Variance  5509.84
                                                             Skewness  −0.029462
                                                             Kurtosis  −0.100286
                                                             N        1000
                                                             Minimum  283.51
                                                             1st Quartile  475.79
                                                             Median   528.07
                      320   400   480  560   640   720       3rd Quartile  576.98
                                                             Maximum  763.87
                                                           95% Confidence Interval for Mean
                                                             522.02   531.23
                                                           95% Confidence Interval for Median
                              95 % Confidence Intervals      522.20   533.84
                                                           95% Confidence Interval for StDev
               Mean                                          71.11    77.63
              Median
                    522   524  526   528  530   532   534

        Figure 10.15 Comparison of process capability between Box--Cox with power −3 and lognor-
        mal fit.
   156   157   158   159   160   161   162   163   164   165   166