
Page 278 - Six Sigma Advanced Tools for Black Belts and Master Black Belts
P. 278
3:5
Char Count= 0
August 31, 2006
JWBK119-17
A Numerical Illustration 263
the assumption translates into
1
(x in ) y i = 0 (17.3)
4
i
From equation (18.3), y m can be solved to give its ‘dummy’ value
ˆ y m =− (x in ) y j . (17.4)
i =m
Thus, with reference to (18.1), all the effects in this experiment can now be estimated:
1 1
ˆ
E j = (x ij ) y i + (x mj ) ˆy m (17.5)
4 4
i =m
ˆ
where E j , E j are the values of the effect of the jth factor calculated based on a set
of eight actual measurements and of seven actual measurements, respectively. With
(18.1), (18.2), and (18.5), it can be shown 12 that the error associated with the estimate
based on the reduced measurement set is
ˆ x mj
E j − E j = E n . (17.6)
x m n
Sincetheerrorisindependentofthevaluesofboth y m and ˆy m ,thevalidityofthezero-
effect assumption about the nth factor is far more important than the fact that y m has
not been presented for the data analysis. This is a reassuring mathematical conclusion
in view of the fact that it is often easier to judge which factor is insignificant than to
hazard a guess at a value for a missing experimental measurement.
17.7 A NUMERICAL ILLUSTRATION
The above analysis will now be illustrated by a numerical example. In a product
reliability study, the failure of an electronic device was traced to weaknesses of an ul-
trasonic weld in the device housing. Five factors of the welding process were included
in a troubleshooting experiment. Owing to the high cost of the devices, a 2 5−2 screen-
ing design was used, with the coded design and results exhibited in Table 17.8. The
design matrix is essentially the same as that shown in Table 17.7, with x 1 , x 2 , x 3 , x 4 and
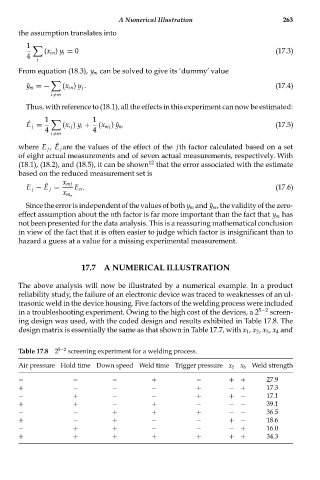
Table 17.8 2 5−2 screening experiment for a welding process.
Air pressure Hold time Down speed Weld time Trigger pressure x 5 x 6 Weld strength
− − − + − + + 27.9
+ − − − + − + 17.3
− + − − + + − 17.1
+ + − + − − − 39.1
− − + + + − − 36.5
+ − + − − + − 18.6
− + + − − − + 16.0
+ + + + + + + 34.3