
Page 82 - Six Sigma Advanced Tools for Black Belts and Master Black Belts
P. 82
OTE/SPH
OTE/SPH
Char Count= 0
August 31, 2006
JWBK119-05
2:55
Case Study: Manpower Resource Planning 67
89.0
79.0
69.0
59.0
Waiting Times 49.0
39.0
29.0
19.0
9.0
8 9 10 11
Number of Packers
8 Dispensing Pharmacists (M/M/S) 8 Dispensing Pharmacists (M/G/S)
9 Dispensing Pharmacists (M/M/S) 9 Dispensing Pharmacists (M/G/S)
10 Dispensing Pharmacists (M/M/S) 10 Dispensing Pharmacists (M/G/S)
11 Dispensing Pharmacists (M/M/S) 11 Dispensing Pharmacists (M/G/S)
(a)
90.0
80.0
70.0
Waiting Times 50.0
60.0
40.0
30.0
20.0
10.0
8 9 10 11
Number of Dispensing Pharmacists
8 Packers (M/M/S) 8 Packers (M/G/S)
9 Packers (M/M/S) 9 Packers (M/G/S)
10 Packers (M/M/S) 10 Packers (M/G/S)
11 Packers (M/M/S) 11 Packers (M/G/S)
(b)
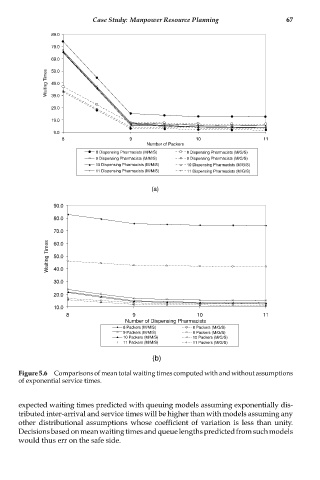
Figure 5.6 Comparisons of mean total waiting times computed with and without assumptions
of exponential service times.
expected waiting times predicted with queuing models assuming exponentially dis-
tributed inter-arrival and service times will be higher than with models assuming any
other distributional assumptions whose coefficient of variation is less than unity.
Decisionsbasedonmeanwaitingtimesandqueuelengthspredictedfromsuchmodels
would thus err on the safe side.