
Page 11 - NASC Safety Report 2022
P. 11
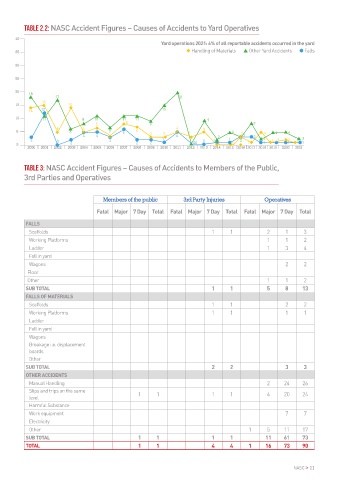
Causes of   40  Table 2.2: NASC Accident Figures – Causes of Accidents to Yard Operatives


                                                          Yard operations 2021: 6% of all reportable accidents occurred in the yard
 accidents   35                                                   u Handling of Materials       s Other Yard Accidents       l Falls


      30

      25
 The 2021 statistics, detailed in Tables 2.1, 2.2 and 3, log the number and cause of accidents to NASC   20
 operatives as well as third parties and members of the public.  18  17  20
      15        15       14
           14  12                                         15
 OPERATIVES – OVERALL INJURIES  There were 13 falls from height by   accidents involving 13 falls from   10  11  8  11  11  11  9
 persons during 2021, the same as   height, 7 work equipment and 3 falls   5  8  9        7
 Of the 89 non-fatal accidents suffered   recorded in 2020.   of materials.  5  4  6  4  5  6  6  4  4  4  4  4  4
 by NASC member operatives during   4  4              3   1 3  4   3          2  1   3 3 3  3  3  1   2    3
 2021, 16 were recorded as Major   The number of falls reported from   OPERATIVES – FATALITIES   0  3  0  2  3  2  2  0 0  0  1  0  0  1  1  1  1  1  1
 injuries, with the remaining 73   scaffolds / working platforms at   2000  2001  2002  2003  2004  2005  2006  2007  2008  2009  2010  2011  2012  2013  2014  2015 2016 2017 2018 2019  2020  2021
 recorded as over 7-days.   or above 4m was 2, down from 5   A driver was killed after sustaining
 recorded in the last report.   multiple injuries in a lorry loader
 Manual handling was the most   incident. This is currently being   Table 3: NASC Accident Figures – Causes of Accidents to Members of the Public,
 common cause of injury to operatives,   These incidents included operatives   investigated by the HSE.   3rd Parties and Operatives
 with the 26 injuries reported   working in contravention of SG4, falls
 accounting for just under one in three   from ladders and falls from vehicles.   THIRD PARTIES
 (29%) of the 2021 total.            Members of the public       3rd Party Injuries           Operatives
 OPERATIVES – MAJOR   The causes of these incidents were
 In second place came slips and trips   falls of materials (2), slips and trips on   Fatal Major 7 Day  Total  Fatal Major 7 Day  Total  Fatal Major 7 Day  Total
 on the same level (24). This is the first   The total number of Major incidents   the same level (1) and fall of a person
 fell from 21 in 2020 to 16 last year.
 time in 17 years that slips and trips   from height (1).   FALLS
 was not the most common cause of   Falls from height by persons and   MEMBERS OF THE PUBLIC  Scaffolds  1  1  2  1  3
 injury.   Other both accounted for 5 of these   Working Platforms                             1     1      2
 incidents, with slips and trips on the   There was a single incident involving   Ladder       1     3      4
 All bar one of these incidents   same level responsible for a further 4.     a member of the public in 2021,
 occurred on site.    the same as recorded in 2020. This   Fall in yard                              2      2
           Wagons
 The most common cause of these   OPERATIVES – 7-DAY  incident and those involving third   Floor
 parties are explored in more depth on
 slips and trips was poor ground   The most common accidents resulting   page 14.   Other      1     1      2
 conditions such as uneven surfaces,   in an absence from work for over   SUB TOTAL  1  1      5     8     13
 poor house keeping, holes and   7 days were attributed to manual
 obstructions due to waste materials   handling (26) closely followed by   FALLS OF MATERIALS
 etc.    slips and trips (24). There were also   Scaffolds                 1      1                  2      2
           Working Platforms                                               1      1                  1      1
           Ladder
           Fall in yard
           Wagons
 Table 2.1: NASC Accident Figures – Causes of Accidents to Site Operatives  Breakage i.e. displacement
           boards
 140  Site operations 2021: 94% of reportable accidents occurred on site   Other
 u Other Site Operations       s Handling of Materials       l Falls       n Falls of Materials  SUB TOTAL  2  2  3  3
 120
          OTHER ACCIDENTS
 100  107  Manual Handling                                                                     2     24    26
 99        Slips and trips on the same
 94  91                                           1     1                  1      1            4     20    24
 80  84  84  level
 80
 72  70    Harmful Substance
 60  53  54  60  60  67  Work equipment                                                              7      7
 52  48  40  56  52  56  45  Electricity
 40  39  41  45  46  36  32  43  43  41  44  36
 29  37  37  26  38  31  Other                                                          1      5     11    17
 28  28  32  21  22  25
 20  24  25  26  18  23  22  15  23  16  23  11  22  17  19  SUB TOTAL  1  1  1   1           11     61    73
 19  9  16  17  5  15  17  13  19  10 16  12  13  11  12  12  TOTAL  1  1  4      4     1     16     73    90
 12  11  15  13  10  9  12  4  7 11  9  6  3
 0  3
 2000  2001  2002  2003  2004  2005  2006  2007  2008  2009  2010  2011  2012  2013  2014  2015  2016  2017 2018  2019 2020 2021
 10 > NASC                                                                                              NASC > 11