Page 9 - NASC Safety Report 2022
P. 9

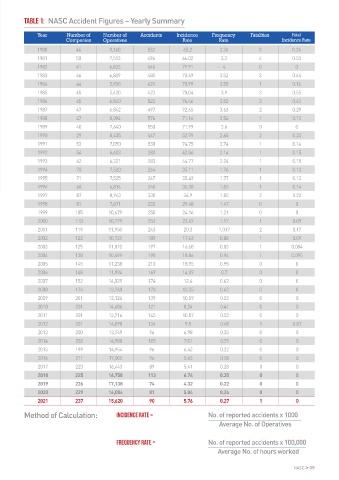
Table 1:  NASC Accident Figures – Yearly Summary


              Year       Number of   Number of    Accidents    Incidence   Frequency     Fatalities     Fatal
                        Companies    Operatives                  Rate         Rate                  Incidence Rate
              1980          46         8,160         532         65.2         3.26          3           0.36
              1981          50         7,513         496         66.02         3.3          4           0.53
              1982          41         6,833         546         79.91         4            0            0
              1983          46         6,809         480         70.49        3.52          3           0.44
              1984          44         5,930         421         70.99        3.55          1           0.16
              1985          45         5,420         423         78.04         3.9          3           0.55
              1986          45         6,840         523         76.46        3.82          3           0.43
              1987          47         6,842         497         72.65        3.63          2           0.29
              1988          47         8,094         576         71.16        3.56          1           0.12
              1989          40          7,640        550         71.99         3.6          0            0
              1990          29          8,435        447         52.99        2.65          2           0.23
              1991          53          7,090        530         74.75        3.74          1           0.14
              1992          54          6,603        283         42.86        2.14          1           0.15
              1993          62          6,321        283         44.77        2.24          1           0.15
 JDC Scaffolding Ltd  1994  70          7,520        264         35.11        1.76          1           0.13
 Fatalities & Injuries   1996  68       6,816        248         36.38        1.82          1           0.14
                                                                 35.49
                            71
                                        7,525
                                                                                                        0.13
                                                     267
                                                                                            1
              1995
                                                                              1.77
                                        8,943
              1997
                            87
                                                                 36.9
                                                                                            2
                                                                                                        0.22
                                                                              1.85
                                                     330
 to operatives  1998       105         10,679        232         29.48        1.47          0           0.09
                                        7,871
                                                                                                         0
                            81
                                                                                                         0
                                                                                            0
                                                                 24.16
                                                     258
                                                                              1.21
              1999
                           110
                                                                                            1
              2000
                                                                              1.17
                                                     253
                                                                 23.47
                                       10,779
                                                                  20.3
                                                                              0.88
                           122
 It is a condition of the NASC membership criteria that every member is required to complete an annual   2001  119  11,950  243  17.63  1.017  2 1  0.17
                                                     189
                                       10,721
              2002
                                                                                                        0.09
 accident return form. This Safety Report is based on factual information reported by all Contractor   2003  125  11,810  197  16.68  0.83  1  0.084
 members of the NASC from January to December 2021.  2004  138  10,499  198  18.86  0.94    1          0.095
              2005         145         11,238        213         18.95        0.95          0            0
 Injuries to Operatives  how infrequent fatalities to NASC   suffered by non-NASC scaffolding   2006  148  11,994  169  14.09  0.7  0  0
 Contractor member operatives have   contractors – in the future.
 The number of accidents reported by   been, particularly from 2005 onwards.   2007  152  14,029  174  12.4  0.62  0  0
 NASC members is based on RIDDOR   However, one fatality is one too many.   Recommendations can be found in the   2008  174  13,760  170  12.35  0.62  0  0
 reportable incidents.   Key Findings and Next Steps section   2009  201  13,124  139  10.59  0.53  0    0
 Similarly, it is disappointing to see the   on pages 19 and 20.
 There were 90 such accidents   number of injuries to operatives rise   2010  201  14,686  121  8.24  0.41  0  0
 recorded in 2021 from a combined   to 90.     The NASC remains committed to   2011  201  13,716  145  10.57  0.53  0  0
 workforce of 15,620 operatives   playing a leading role in scaffolding   2012  201  14,098  134  9.5   0.48  1  0.07
 employed by 237 Contractor   To look at the positives, Table 1 shows   industry safety. As such, incident
 members.   that double digit rather than triple   data will once again also be shared   2013  200  13,749  96  6.98  0.35  0  0
 digit accident numbers have been the   with the Health & Safety Executive   2014  202  14,988  105  7.01  0.35  0  0
 This represents a slight increase in   norm since 2013 and this continued   (HSE) and sub-groups such as the
 our accident frequency rate from   in 2021.     Construction Industry Advisory   2015  199  14,954  96  6.42  0.32  0  0
 the previous year (see Table 1 on the   Network (CONIAN) to support them in   2016  211  17,005  96  5.65  0.28  0  0
 opposite page) by NASC members.   The headline figures, as always, are   the development of further regulation   2017  223  16,443  89  5.41  0.28  0  0
 not the most important aspect of the   and safety campaigns.   2018  225  16,758  113  6.74  0.35  0    0
 Fatalities to Operatives  NASC’s Safety Report.   2019  226  17,138  74  4.32  0.22        0            0
 Rather, the purpose of this Report is
 There was sadly one fatality reported   to analyse the data to identify trends,   2020  229  16,084  81  5.04  0.24  0  0
 during 2021, the first since 2012.   such as the causes of incidents and   2021  237  15,620  90  5.76  0.27  1  0
 the age and experience of the injured   90
 ANALYSIS  operatives, to help us put preventative   Method of Calculation:  Incidence rate =     No. of reported accidents x 1000
 measures in place wherever possible                                              Average No. of Operatives
 It is disappointing to see the number   to lower accident numbers – both   ACCIDENTS IN 2021
 of fatalities to operatives as anything   recorded and reported by NASC
 other than zero. Table 1 shows   Contractor members and those   Frequency rate =      No. of reported accidents x 100,000
                                                                                 Average No. of hours worked
 08 > NASC                                                                                              NASC > 09
   4   5   6   7   8   9   10   11   12   13   14