
Page 10 - Edwards AFB Desert Wings 6-26-15
P. 10
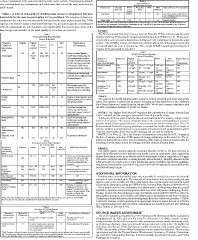
certain contaminants in the water provided by public water systems. Department regulations Table 4
also establish limits for contaminants in bottled water that provide the same protection for Lead and Copper
public health.
Sep 2012 and Oct 2013
Contaminant Samples 90th % Exceeding MCL PHG Typical Source of Contaminant
Collected Level MCL (MCLG)
Found
Tables 1 to 4 list all of the primary drinking water standard contaminants that were Lead (ppb) 32 0.00116 0 15 0.2 Internal corrosion of household
detected during the most recent sampling for the constituent. The presence of these con- water plumbing systems; erosion
taminants in the water does not necessarily indicate that the water poses a health risk. DDW
requires us to monitor certain contaminants less than once per year because the concentrations of natural deposits
of these contaminants are not expected to vary significantly from year to year. Some of the
data, though representative of the water quality, is more than one-year old. Copper (ppb) 32 0.546 0 1.3 0.3 Natural deposits
*Note: The table above shows that federal standards for Lead and Copper are met. California State standards however are
not met but they constitute our Maximum Contaminant Level Goal (MCLG) and these are not required by law. This does
not indicate that the water poses a health risk.
Table 1 UCMR3
Primary Drinking Water Standard The Environmental Protection Agency required Edwards AFB to collect quarterly water
samples under the Unregulated Contaminant Monitoring Rule (Tables 5 to 6). These quar-
1 Jan to 31 Dec 2014 terly samples were not used to determine compliance or non-compliance of the potable water
system. The UCMR3 results will determine whether additional contaminant monitoring
Chemical or Violation Highest Range of MCL PHG Typical Source is required after one year of monitoring. The current UCMR3 sampling period began in
Constituent No level Detections (MCLG) of Contaminant October 2013 and ended in July 2014.
(and reporting
units) No detected
Arsenic (ppb)
10.5 ND – 10.5 10 10 Erosion of natural deposits; Table 5
Chromium (ppb) Nov 12 (Avg. 5.85) runoff from orchards; glass and
2014 electronics production wastes. UCMR3 (Distribution System)
The state of California requires
EAFB to have an average under 1 Jan to 31 July 2014
10 for arsenic. EAFB has an
average annual arsenic value of Chemical or Violation Highest MCL PHG Typical Source
5.85. Constituent Level Range of Detections (MCLG) of
(and reporting units) No Contaminant
2.5 Discharge from steel and pulp Chromium (total) N/A Detected 0.05 mg/L N/A
mills and chrome plating; erosion Cobalt N/A Un- N/A
of natural deposits N/A 5.7 µg/L 1.8 µg/L – 5.7 µg/L 0.05 mg/L regulated
Molybdenum N/A Un- N/A
N/A 1.07 µg/L ND - 1.07 µg/L Un- regulated
Strontium N/A 8 pCi/L N/A
regulated
Vanadium
15.5 ND - 15.5 50 5.1 µg/L 1.4 µg/L – 5.1 µg/L Un-
Chromium-VI at
UCMR3 sites regulated
Chlorate
417 µg/L 280 µg/L - 417 8 pCi/L
µg/L
12 µg/L 4.7 µg/L - 12 µg/L Un- Un- N/A
regulated N/A
7.01 0.259 – 7.01 Not ? Not typically required for regulated N/A
Un-
No Regulat Edwards; however this sample 0.28 µg/L 0.22 µg/L - 0.28 Un- regulated
Chromium VI ed was collected for a DDW study. µg/L regulated Un-
regulated
92 µg/L 43.4 µg/L- 92 µg/L Un-
regulated
Fluoride No ND ND – .213 2.0 1.0 Erosion of natural deposits; water Arsenic
(mg/L) additive; discharge from fertilizer The water in the EAFB drinking-water system is a blend of EAFB well water and AVEK
and aluminum plants water. This method is referred to as arsenic blending and was approved by the California
State Water Resources Control Board in January 2006. We do this to ensure compliance with
Nitrate as N No 0.391 0.206- 0.391 ? ? Runoff and leaching from the EPA-established standard of 10 ppb for arsenic.
fertilizer use; leaching from
septic tanks, sewage; erosion of NOTE 1: The “highest level detected” represents the concentration of arsenic directly from
natural deposits ONLY one well and the average is determined from all the wells in use.
Nitrate (as NO3) No 9.96 1.08- 9.96 45 45 Runoff and leaching from While your drinking water meets the federal and state standard for arsenic, it does contain
low levels of arsenic. The arsenic standard balances the current understanding of arsenic’s
(ppm) fertilizer use; leaching from possible health effects against the costs of removing arsenic from drinking water. The U.S.
Environmental Protection Agency continues to research the health effects of low levels of
septic tanks, sewage; erosion of arsenic, which is a mineral known to cause cancer in humans at high concentrations, and is
linked to other health effects such as skin damage and circulatory problems.
natural deposits
NOTE 2: On Nov. 12, 2014, the blended concentrations exceeded the MCL, because at
Total No 55.2 ND – 55.2 80 N/A By-product of chlorination the time of sample collection AVEK was performing maintenance to the main line. The re-
sults from that occurrence were not representative of the water consumed, because after the
Trihalomethanes blending point the water is sent to a storage tank that contains blended water.
(ppb)
Haloacetic Acids No 14.3 ND – 14.3 60 By-product of chlorination
(ppb) N/A
Gross Alpha (pCi/l) > action S9.e5condary 3D.1ri–nTk6ai.bn3lg2e W2 ater1S5tandard 0 Radioactive mineral deposits
level/ No
Chemical or Vviioollaattiioonn 1 Jan to 31 Dec 2010 Additional information
Constituent
No Range Avg. MCL PHG Use of Perchlorate containing Fluoride
P(aenrcdhrleoproartetisn(gppb) munitions Our water system contains naturally occurring fluoride. AVEC or CE does not treat or
N/A ND (MCLG) inject any additional levels to help prevent dental caries in consumers. State regulations
units) It is the sum of polyvalent cations require the fluoride levels in the treated water be maintained within a range below 2.0 ppm.
Hardness (ppm) ND 6 N/A present in the water, generally The water system has naturally occurring fluoride, below the MCL. Monthly amounts on this
magnesium and calcium. The table are based on routine source water monitoring and not monthly distribution sampling.
48 - 112 79.54 None N/A cations are usually naturally http://www.waterboards.ca.gov/drinking_water/certlic/drinkingwater/documents/fluorida-
occurring
Sodium N/A 41.9 - 146 75.3 None N/A tion/Tables/Data2013.pdf
N/A
Specific N/A 346-526 526 1600 N/A Substances that form ions when ADDITIONAL INFORMATION
Conductance N/A 39.8-345 311.2 1000 in water; seawater influence
(µS/cm) Drinking water, including bottled water, may reasonably be expected to contain at least small
500 N/A amounts of some contaminants. The presence of contaminants does not necessarily indicate
Total Dissolved that the water poses a health risk. More information about contaminants and potential health
Solids (TDS) (ppm) effects can be obtained by calling the USEPA’s Safe Drinking Water Hotline (1-800-426-4791).
Color (units) N/A 3 - 58 11.4 15 N/A Naturally-occurring organic Some people may be more vulnerable to contaminants in drinking water than the general
materials population. Immuno-compromised persons such as persons with cancer undergoing chemo-
therapy, persons who have undergone organ transplants, people with HIV/AIDS or other im-
Turbidity N/A 0.11 - 23.8 1.37 5 N/A Turbidity is a measure of the mune system disorders, some elderly, and infants can be particularly at risk from infections.
(National Turbidity cloudiness of the water. We These people should seek advice about drinking water from their health care providers. USEPA/
Centers for Disease Control guidelines on appropriate means to lessen the risk of infection
Units) monitor it because it is a good by Cryptosporidium and other microbial contaminants are available from the Safe Drinking
indicator of water quality. High Water Hotline (1-800-426-4791).
turbidity can hinder the
effectiveness of disinfectants.
*Note: The state of California monitors secondary drinking water standards such as, color, hardness, and turbidity.
However, they do not represent a health hazard if desired threshold is exceeded.
Table 3
Detection of Coliform Bacteria
1 Jan to 31 Dec 2014 SOURCE WATER ASSESSMENT
Microbial Highest No. MCL PHG Typical Source of Bacteria The Civil Engineering Department at EAFB produced the 2003 Source Water Assessment,
Contaminants of Detection completed June 18, 2003, and is on file in the CE office (661-277-5000). Possible contami-
(MCLG) Naturally present in the nating activities for the wells surveyed in this assessment include nearby abandoned wells,
Coliform, Total 0 environment storm drainage discharge, above ground water storage tanks and nearby roads. The health risks
No more than 1 positive monthly 0 from these activities are diminished through weekly monitoring of the potable water system.
AVEK also provides a Source Water Assessment for the water they distribute. This is a state
sample requirement and lists the Physical Barrier Effectiveness, Inventory of Possible Contaminat-
ing Activities, Vulnerability Ranking, Assessment Map, Assessment Summary and Public
Coliform, Fecal or 0 A routine sample and a repeat sam- 0 Human and animal fecal waste Notification procedures.
E.coli ple are total coliform positive, and
one of these is also fecal coliform
or E. coli positive
*Note: Samples collected during the month of November detected as positives do not indicate that the water poses a health
risk. Our assessment indicates that weather conditions like extensive rainfall, stagnant water and error in sampling protocol
affected the sampling results. After re-sampling the results were identified as negative.