
Page 64 - Demo
P. 64
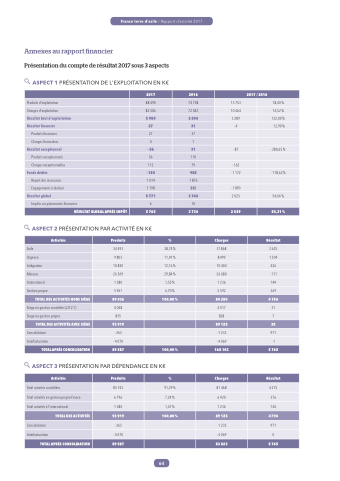
Annexes au rapport  nancier
Présentation du compte de résultat 2017 sous 3 aspects
ASPECT 1 PRÉSENTATION DE L'EXPLOITATION EN K€
France terre d’asile / Rapport d’activité 2017
2017
2016
2017 / 2016
Produits d'exploitation
88 490
74 738
13 753
18,40 %
Charges d'exploitation
82 506
72 042
10 464
14,52 %
Résultat brut d'exploitation
5 984
2 696
3 289
122,00 %
Résultat  nancier
27
31
-4
- 12,90 %
Produits  nanciers
27
37
Charges  nancières
0
7
Résultat exceptionnel
- 56
31
- 87
-280,65 %
Produits exceptionnels
56
110
Charges exceptionnelles
112
79
- 162
Fonds dédiés
- 184
988
- 1 172
- 118,62 %
Report des ressources
1 014
1 876
Engagements à réaliser
1 198
888
-1890
Résultat global
5 771
3 746
2 025
54,06 %
Impôts sur placements  nanciers
6
10
RÉSULTAT GLOBAL APRÈS IMPÔT
5 765
3 736
2 029
54,31 %
ASPECT 2 PRÉSENTATION PAR ACTIVITÉ EN K€
Activités
Produits
%
Charges
Résultat
Asile
34 493
38,74 %
31 868
2 625
Urgence
9 803
11,01 %
8 499
1 304
Intégration
10 830
12,16 %
10 404
426
Mineurs
26 569
29,84 %
26 680
- 111
International
1 380
1,55 %
1 236
144
Gestion propre
5 961
6,70 %
5 592
369
TOTAL DES ACTIVITÉS HORS SIÈGE
89 036
100,00 %
84 280
4 756
Siège en gestion contrôlée (L312-1)
4 048
4 017
31
Siege en gestion propre
835
828
7
TOTAL DES ACTIVITÉS AVEC SIÈGE
93 919
89 125
38
Consolidation
- 263
- 1 233
971
Interfacturation
- 4 070
- 4 069
-1
TOTAL APRÈS CONSOLIDATION
89 587
100,00 %
168 103
5 765
ASPECT 3 PRÉSENTATION PAR DÉPENDANCE EN K€
Activités
Produits
%
Charges
Résultat
Total activités contrôlées
85 743
91,29 %
81 468
4 275
Total activités en gestion propre France
6 796
7,24 %
6 420
376
Total activités à l'international
1 380
1,47 %
1 236
144
TOTAL DES ACTIVITÉS
93 919
100,00 %
89 125
4 794
Consolidation
- 263
- 1 233
971
Interfacturation
- 4 070
- 4 069
0
TOTAL APRÈS CONSOLIDATION
89 587
83 823
5 765
64
