Page 46 - Flipbook January Board
P. 46

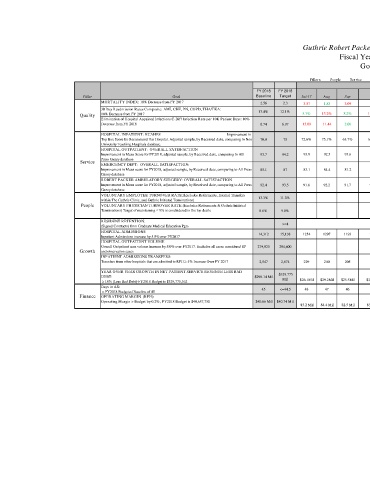
Guthrie Robert Packer Hospital Scorecard
                                                                                                                 Fiscal Year:   2018
                                                                                                                        Goals


                                                                                                        Pillars:         People          Service          Quality          Financial          Growth
                                                                                                                                                      FY 2018
                                                                                      FY 2018   FY 2018                                                                                                          Explanation and
                             Pillar                       Goal                        Baseline  Target  Jul-17  Aug  Sep   Oct      Nov     Dec    Jan-18  Feb     Mar     Apr     May      Jun       FYTD       Corrective Action
                                  MORTALITY INDEX: 10% Decrease from FY 2017           2.56    2.3   3.57   1.83   3.09    2.18     1.7      2.96   2.49   1.92    1.72    2.6     3.13                2.42
                                  30 Day Readmission Rates Composite: AMI, CHF, PN, COPD, THA/TKA:  13.4%  12.1%
                           Quality  10% Decrease from FY 2017                                        5.3%  13.2%   8.2%    14.2%    11.9%   12.3%   12.0%  12.4%   9.2%   11.5%                        11.2%
                                  Elimination of Hospital Acquired Infections C-Diff Infection Rate per 10K Patient Days: 10%
                                  Decrease from FY 2016                                6.74   6.07   13.09  11.44  2.06    3.63     6.06     8.52   5.46   11.9    1.78    7.95    3.77      9.7       7.04
                                  HOSPITAL INPATIENT: HCAHPS                                                                       Improvement in
                                  Top Box Score for Recommend this Hospital. Adjusted sample, by Received date, comparing to Non-  70.9  75  72.6%  75.1%  63.7%  68.3%  66.8%  65.9%  58.1%  67.3%  70.0%  68.5%  68.9%  63.2%  67.4%
                                  University Teaching Hospitals database.                                                                                                                                     As of 7/10/2018
                                  HOSPITAL OUTPATIENT:  OVERALL SATISFACTION
                                  Improvement in Mean Score for FY2018, adjusted sample, by Received date, comparing to All   93.7  94.2  93.9  92.5  93.6  91.7  91.5  92.3  93.8  93.9  92  93.9  93.2  94.6  93.1
                            Service  Press Ganey database                                                                                                                                                     As of 7/10/2018
                                  EMERGENCY DEPT:  OVERALL SATISFACTION:
                                  Improvement in Mean score for FY2018, adjusted sample, by Received date, comparing to All Press   85.1  87  83.1  84.4  81.2  84.6  85.8  80.8  82.4  86.7  78.6  84.7  83.6  85.7  83.4
                                  Ganey database                                                                                                                                                              As of 7/10/2018
                                  ROBERT PACKER AMBULATORY SURGERY: OVERALL SATISFACTION
                                  Improvement in Mean score for FY2018, adjusted sample, by Received date, comparing to All Press   92.4  93.5  91.8  92.2  91.7  92.2  91.0  92.3  91.6  91.9  92.1  92.6  91.1  93  92
                                  Ganey database                                                                                                                                                              As of 7/10/2018
                                  VOLUNTARY EMPLOYEE TURNOVER RATE:(Excludes Retirements, Internal Transfers   13.3%  11.0%                                                                                        Quarterly
                                  within The Guthrie Clinic, and Guthrie Initiated Terminations)
                            People  VOLUNTARY PHYSICIAN TURNOVER RATE:(Excludes Retirements & Guthrie Initiated                                                                                                   Annually
                                  Terminations) Target of maintaining ≤ 9% is condsidered in the top decile  8.6%  9.0%
                                  RESIDENT RETENTION:
                                  (Signed Contracts) from Graduate Medical Education Pgm      >=4                                             1 as of 10/10/2017
                                  HOSPITAL ADMISSIONS:                                 14,312  15,138  1254  1297  1193    1395     1176    1099    1297   1209    1357   1262     1294     1221       15054
                                  Inpatient Admissions increase by 5.8% over FY2017
                                  HOSPITAL OUTPATIENT VOLUME
                                  Overall Outpatient case volume increase by 5.0% over FY2017. Excludes all cases considered SP   279,920  294,600                                                     NA
                           Growth  and observation cases
                                  INPATIENT ADMISSIONS TRANSFERS:
                                  Transfers from other hospitals that are admitted to RPH ≥ 5% Increase Over FY 2017  2,547  2,674  229  240  205  239  222  219  241  203  284  218  207   235        2742

                                  YEAR OVER YEAR GROWTH IN NET PATIENT SERVICE REVENUE LESS BAD
                                  DEBT:                                               $298.14 Mil    $329.775
                                   ≥ 10% (Less Bad Debt)-FY2018 Budget is $329,775,562        Mil    $26.1Mil    $29.2Mil    $25.5Mil    $28.8Mil    $25.7Mil    $23.6Mil    $26.1Mil    $26.9 Mil    $29.5 Mil    $29.6 Mil    $30.8 Mil    $         27,353,406   $          329,175,127
                                  Days in AR:                                           45    <=44.5  48     47    46       48       46      45      47     47     45      45      42        43         43
                                   < FY2018 Budgeted Baseline of 45
                           Finance  OPERATING MARGIN  (RPH):
                                  Operating Margin > Budget by 0.2%, FY2018 Budget is $40,657,750   $40.66 Mil  $40.74 Mil
                                                                                                     $3.2 Mil    $4.4 Mil    $2.5 Mil    $3.4 Mil    $2.3 Mil    $.3 Mil    $1.8Mil    $3.1Mil    $3.2Mil    $3.7Mil    $4.4 Mil    $           1,336,379   $            33,588,353
   41   42   43   44   45   46   47   48   49   50   51