
Page 25 - Marine Magnetometer Processing
P. 25
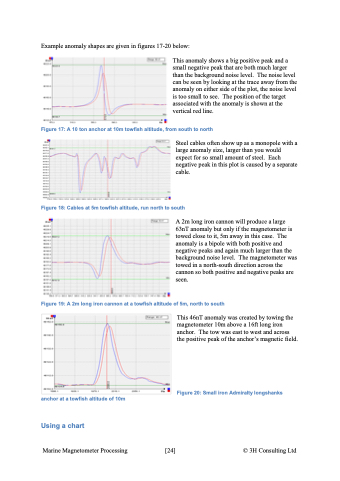
Example anomaly shapes are given in figures 17-20 below: This anomaly shows a big positive peak and a small negative peak that are both much larger than the background noise level. The noise level can be seen by looking at the trace away from the anomaly on either side of the plot, the noise level is too small to see. The position of the target associated with the anomaly is shown at the vertical red line. Figure 17: A 10 ton anchor at 10m towfish altitude, from south to north Steel cables often show up as a monopole with a large anomaly size, larger than you would expect for so small amount of steel. Each negative peak in this plot is caused by a separate cable. Figure 18: Cables at 5m towfish altitude, run north to south A 2m long iron cannon will produce a large 63nT anomaly but only if the magnetometer is towed close to it, 5m away in this case. The anomaly is a bipole with both positive and negative peaks and again much larger than the background noise level. The magnetometer was towed in a north-south direction across the cannon so both positive and negative peaks are seen. Figure 19: A 2m long iron cannon at a towfish altitude of 5m, north to south anchor at a towfish altitude of 10m Using a chart This 46nT anomaly was created by towing the magnetometer 10m above a 16ft long iron anchor. The tow was east to west and across the positive peak of the anchor’s magnetic field. Figure 20: Small iron Admiralty longshanks Marine Magnetometer Processing \[24\] © 3H Consulting Ltd
