
Page 27 - Marine Magnetometer Processing
P. 27
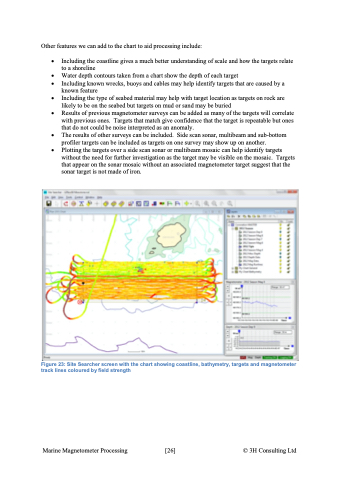
Other features we can add to the chart to aid processing include: • Including the coastline gives a much better understanding of scale and how the targets relate to a shoreline • Water depth contours taken from a chart show the depth of each target • Including known wrecks, buoys and cables may help identify targets that are caused by a known feature • Including the type of seabed material may help with target location as targets on rock are likely to be on the seabed but targets on mud or sand may be buried • Results of previous magnetometer surveys can be added as many of the targets will correlate with previous ones. Targets that match give confidence that the target is repeatable but ones that do not could be noise interpreted as an anomaly. • The results of other surveys can be included. Side scan sonar, multibeam and sub-bottom profiler targets can be included as targets on one survey may show up on another. • Plotting the targets over a side scan sonar or multibeam mosaic can help identify targets without the need for further investigation as the target may be visible on the mosaic. Targets that appear on the sonar mosaic without an associated magnetometer target suggest that the sonar target is not made of iron. Figure 23: Site Searcher screen with the chart showing coastline, bathymetry, targets and magnetometer track lines coloured by field strength Marine Magnetometer Processing \[26\] © 3H Consulting Ltd
