
Page 30 - Marine Magnetometer Processing
P. 30
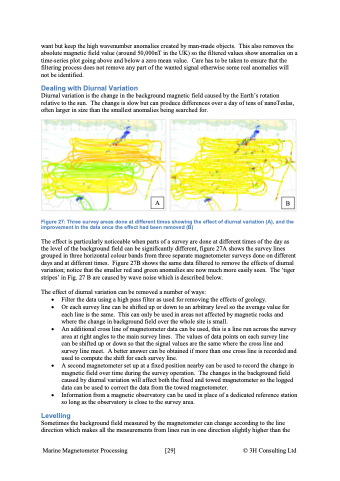
want but keep the high wavenumber anomalies created by man-made objects. This also removes the absolute magnetic field value (around 50,000nT in the UK) so the filtered values show anomalies on a time-series plot going above and below a zero mean value. Care has to be taken to ensure that the filtering process does not remove any part of the wanted signal otherwise some real anomalies will not be identified. Dealing with Diurnal Variation Diurnal variation is the change in the background magnetic field caused by the Earth’s rotation relative to the sun. The change is slow but can produce differences over a day of tens of nanoTeslas, often larger in size than the smallest anomalies being searched for. Figure 27: Three survey areas done at different times showing the effect of diurnal variation (A), and the improvement in the data once the effect had been removed (B) The effect is particularly noticeable when parts of a survey are done at different times of the day as the level of the background field can be significantly different, figure 27A shows the survey lines grouped in three horizontal colour bands from three separate magnetometer surveys done on different days and at different times. Figure 27B shows the same data filtered to remove the effects of diurnal variation; notice that the smaller red and green anomalies are now much more easily seen. The ‘tiger stripes’ in Fig. 27 B are caused by wave noise which is described below. The effect of diurnal variation can be removed a number of ways: • Filter the data using a high pass filter as used for removing the effects of geology. • Or each survey line can be shifted up or down to an arbitrary level so the average value for each line is the same. This can only be used in areas not affected by magnetic rocks and where the change in background field over the whole site is small. • An additional cross line of magnetometer data can be used, this is a line run across the survey area at right angles to the main survey lines. The values of data points on each survey line can be shifted up or down so that the signal values are the same where the cross line and survey line meet. A better answer can be obtained if more than one cross line is recorded and used to compute the shift for each survey line. • A second magnetometer set up at a fixed position nearby can be used to record the change in magnetic field over time during the survey operation. The changes in the background field caused by diurnal variation will affect both the fixed and towed magnetometer so the logged data can be used to correct the data from the towed magnetometer. • Information from a magnetic observatory can be used in place of a dedicated reference station so long as the observatory is close to the survey area. Levelling Sometimes the background field measured by the magnetometer can change according to the line direction which makes all the measurements from lines run in one direction slightly higher than the A B Marine Magnetometer Processing \[29\] © 3H Consulting Ltd
