
Page 40 - Marine Magnetometer Processing
P. 40
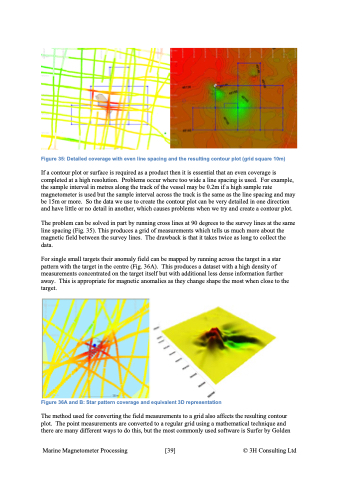
Figure 35: Detailed coverage with even line spacing and the resulting contour plot (grid square 10m) If a contour plot or surface is required as a product then it is essential that an even coverage is completed at a high resolution. Problems occur where too wide a line spacing is used. For example, the sample interval in metres along the track of the vessel may be 0.2m if a high sample rate magnetometer is used but the sample interval across the track is the same as the line spacing and may be 15m or more. So the data we use to create the contour plot can be very detailed in one direction and have little or no detail in another, which causes problems when we try and create a contour plot. The problem can be solved in part by running cross lines at 90 degrees to the survey lines at the same line spacing (Fig. 35). This produces a grid of measurements which tells us much more about the magnetic field between the survey lines. The drawback is that it takes twice as long to collect the data. For single small targets their anomaly field can be mapped by running across the target in a star pattern with the target in the centre (Fig. 36A). This produces a dataset with a high density of measurements concentrated on the target itself but with additional less dense information further away. This is appropriate for magnetic anomalies as they change shape the most when close to the target. Figure 36A and B: Star pattern coverage and equivalent 3D representation The method used for converting the field measurements to a grid also affects the resulting contour plot. The point measurements are converted to a regular grid using a mathematical technique and there are many different ways to do this, but the most commonly used software is Surfer by Golden Marine Magnetometer Processing \[39\] © 3H Consulting Ltd
