
Page 100 - The ROV Manual - A User Guide for Remotely Operated Vehicles 2nd edition
P. 100
88 CHAPTER 3 Design Theory and Standards
FIGURE 3.28
Small ROV drag curve at 2.0 knots
Small ROV A Net Thrust
Small ROV B Net Thrust
Small ROV C Net Thrust
Medium ROV A Net Thrust
Large ROV A Net Thrust
Large ROV B Net Thrust
10 20 50 100 150 200 250
Tether length in feet
Drag curves of systems tested at 2.0 knots.
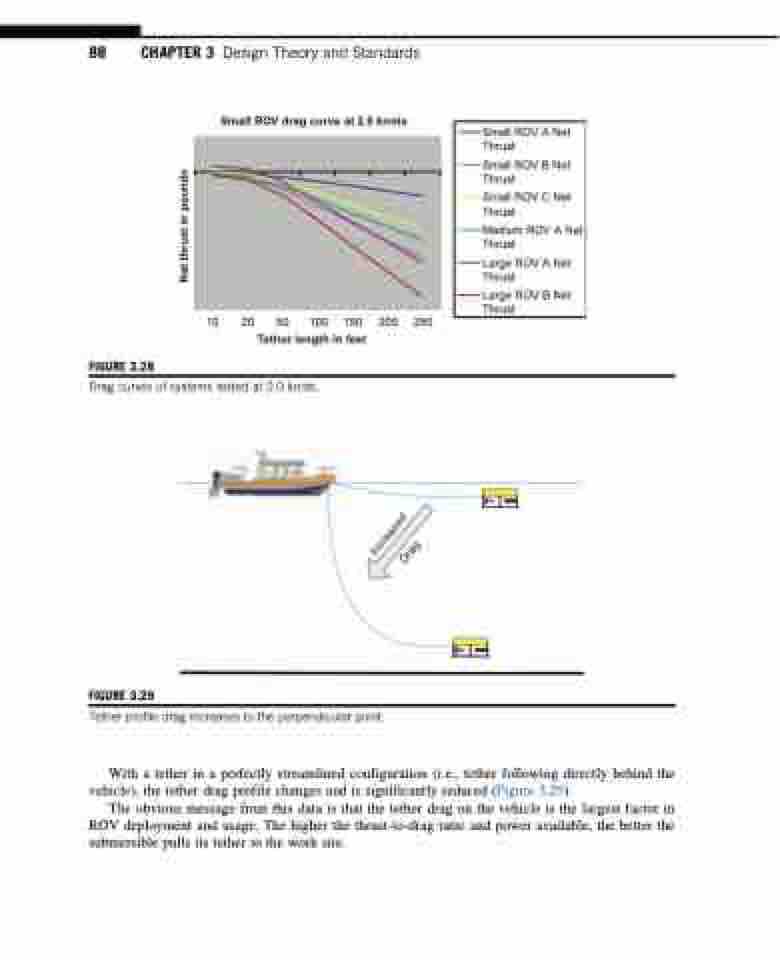
FIGURE 3.29
Tether profile drag increases to the perpendicular point.
With a tether in a perfectly streamlined configuration (i.e., tether following directly behind the vehicle), the tether drag profile changes and is significantly reduced (Figure 3.29).
The obvious message from this data is that the tether drag on the vehicle is the largest factor in ROV deployment and usage. The higher the thrust-to-drag ratio and power available, the better the submersible pulls its tether to the work site.
Net thrust in pounds
Increased Drag
