
Page 21 - 44-Summer 2015_Final
P. 21
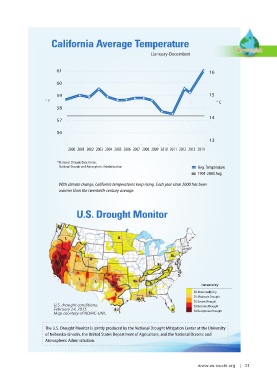
California Average Temperature
                                                            (January-December)


                       61
                                                                                   16

                       60
                       59                                                          15
                   ° F                                                               ° C
                       58
                                                                                   14
                       57

                       56
                                                                                   13

                            2000 2001 2002 2003 2004 2005 2006 2007 2008 2009 2010 2011 2012 2013 2014

                       * National Climatic Data Center,
                          National Oceanic and Atmospheric Administration     Avg. Temperature
                                                                              1901-2000 Avg.

                        With climate change, California temperatures keep rising. Each year since 2000 has been
                        warmer than the twentieth-century average.


                               U.S. Drought Monitor


                                                                                Intensity
                                                                             D0 Abnormally Dry
                                                                             D1 Moderate Drought
                                                                             D2 Severe Drought
                      U.S. drought conditions,                               D3 Extreme Drought
                      February 24, 2015.                                     D4 Exceptional Drought
                      Map courtesy of NDMC-UNL.

                   The U.S. Drought Monitor is jointly produced by the National Drought Mitigation Center at the University
                   of Nebraska-Lincoln, the United States Department of Agriculture, and the National Oceanic and
                   Atmospheric Administration.


                                                                              www.us.tzuchi.org    |   21